Installs all 26 components. Without our CLI, run instead.
gpt-vis publishes a shadcn registry at gpt-vis.antv.vision, with 26 components installable through the shadcn CLI.
Copy a prompt for your agent, copy the install command, or open the docs that ship it.
An area chart component for @antv/gpt-vis. Show data trends over time with optional stacking.
A horizontal bar chart component for @antv/gpt-vis. Compare categorical data with optional grouping and stacking.
A boxplot chart component for @antv/gpt-vis. Compare statistical distributions across categories.
A vertical column chart component for @antv/gpt-vis. Compare categorical data with optional grouping and stacking.
A dual axes chart component for @antv/gpt-vis. Combine column and line charts for trend and comparison.
A fishbone diagram component for @antv/gpt-vis. Display cause-and-effect analysis with a fish skeleton structure.
A flow diagram component for @antv/gpt-vis. Show process steps and decision points.
A histogram chart component for @antv/gpt-vis. Show frequency distribution of data points within ranges.
An indented tree component for @antv/gpt-vis. Display hierarchical data with indented layout.
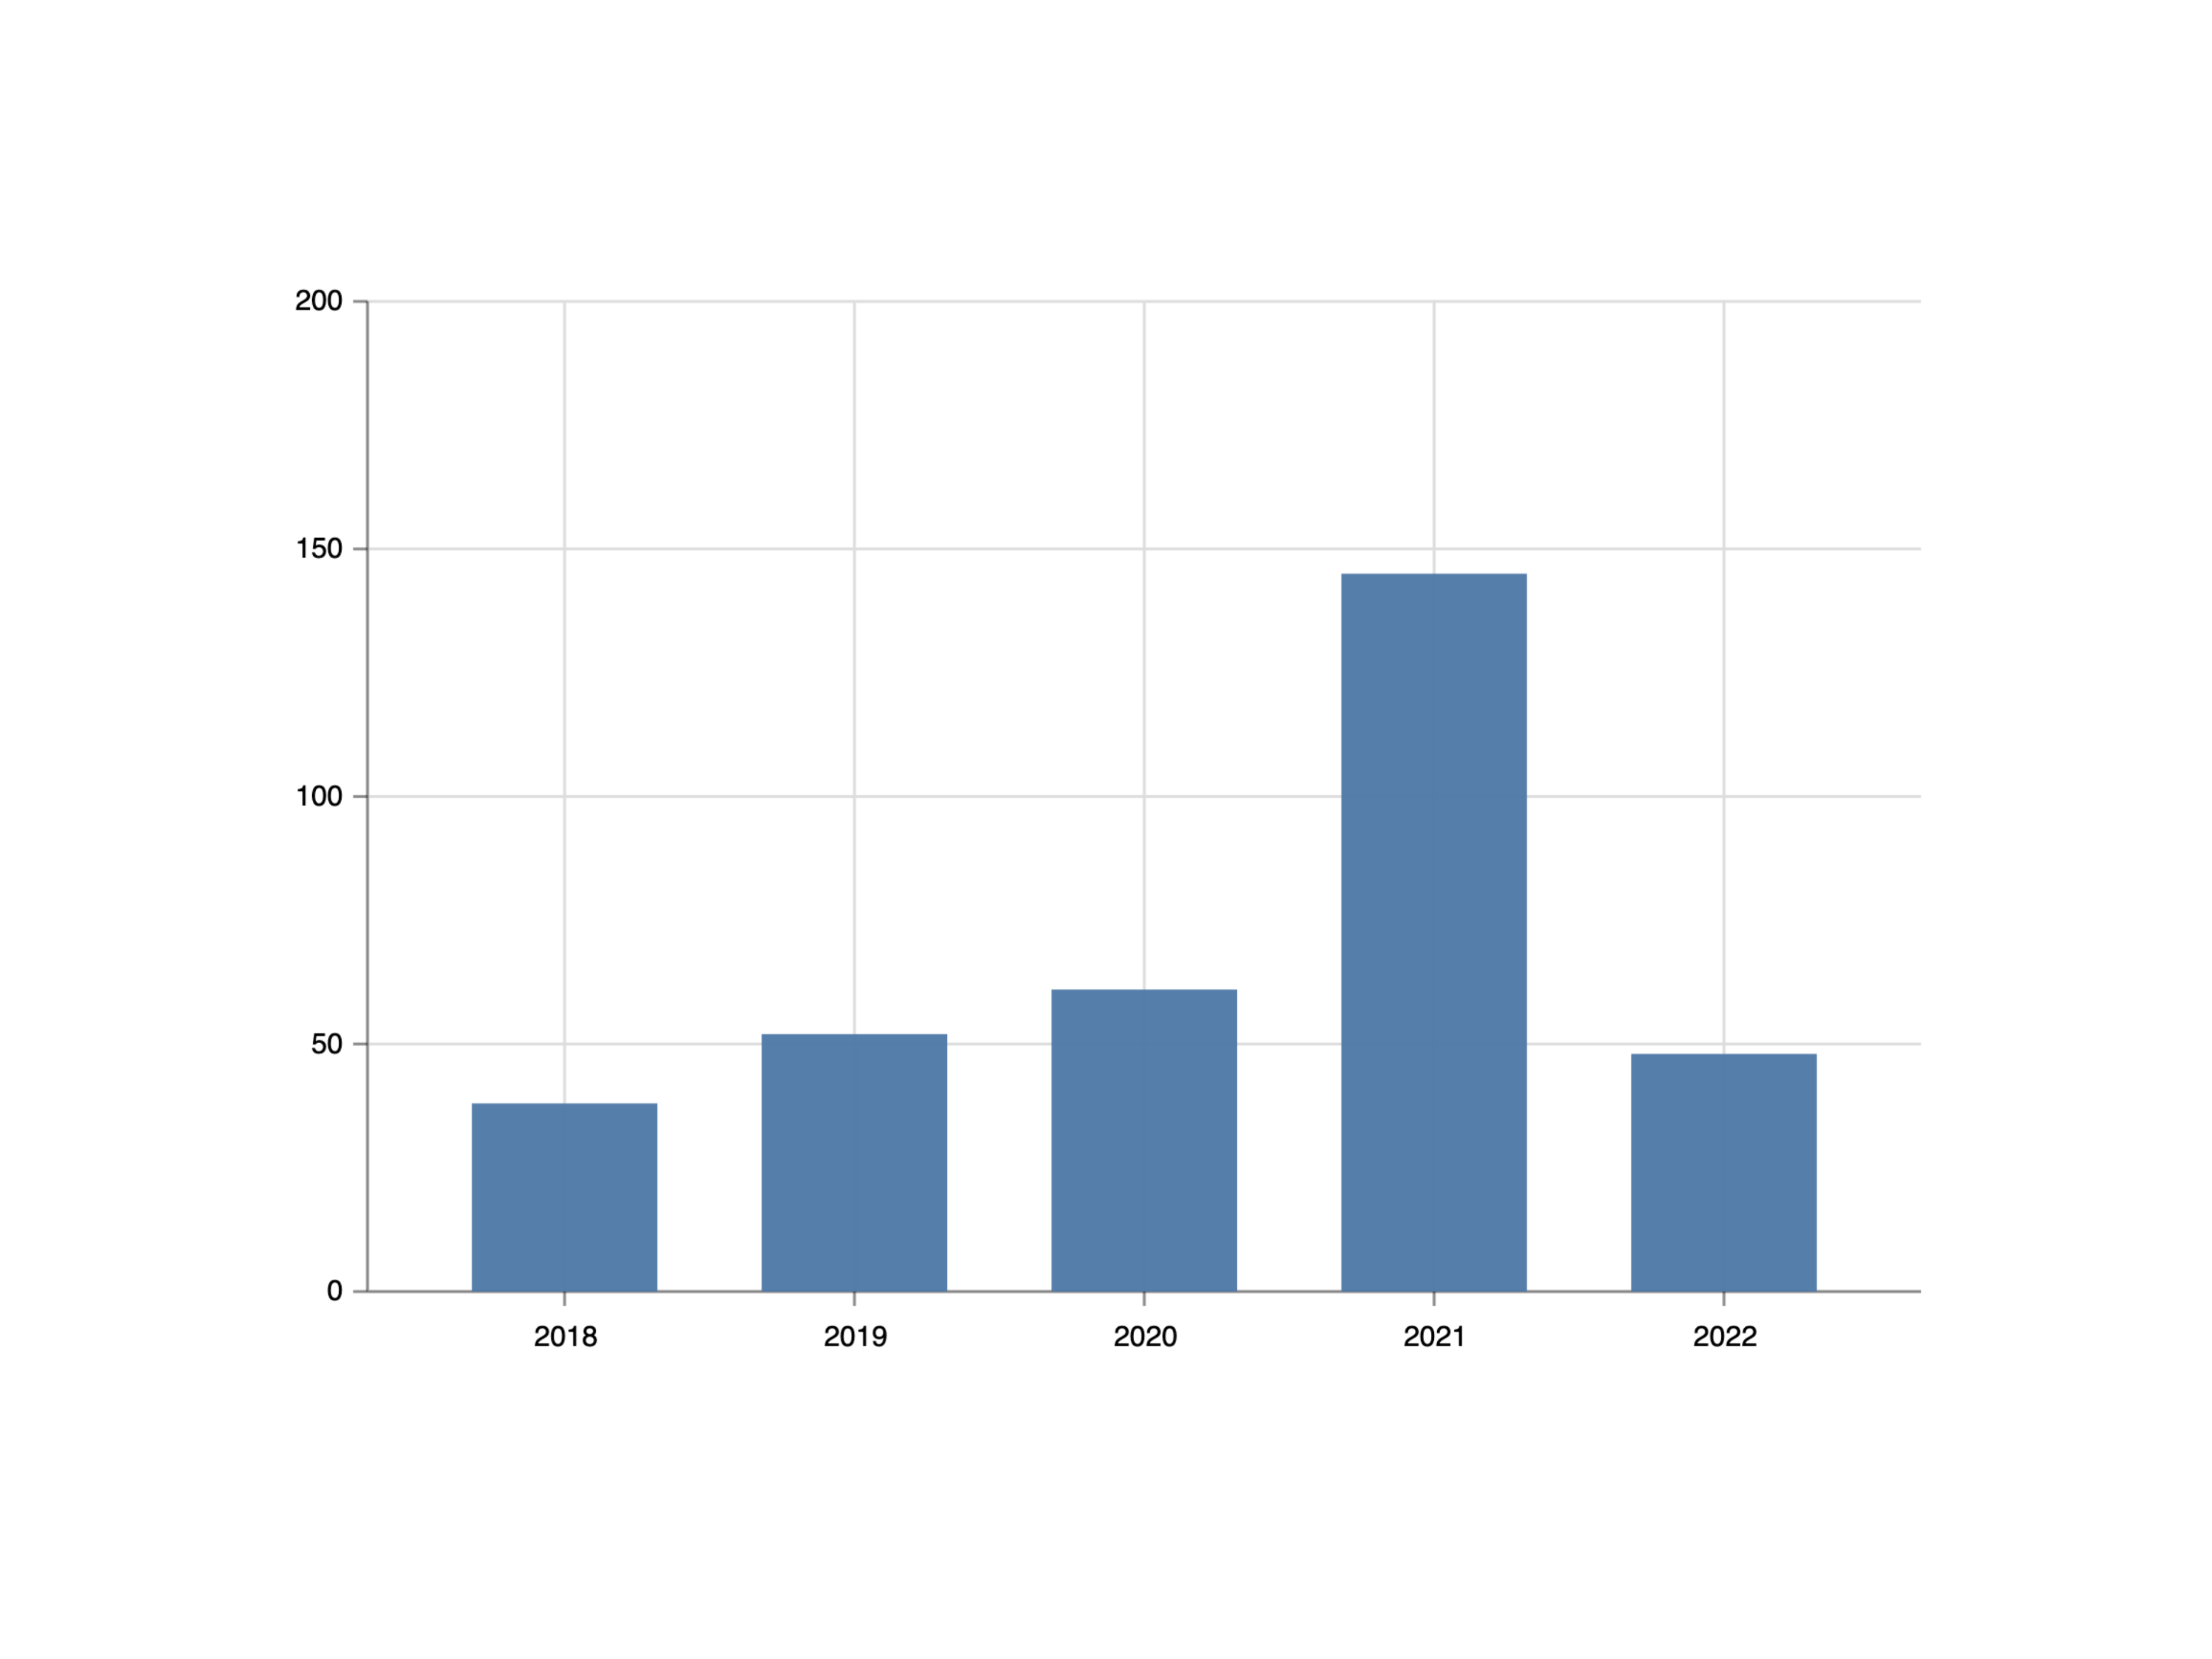
A line chart component for @antv/gpt-vis. Visualize trends over time with optional multi-series grouping.
A liquid fill chart component for @antv/gpt-vis. Display a single percentage value with various shapes.
A mind map component for @antv/gpt-vis. Organize hierarchical information with branches from a central topic.
A network graph component for @antv/gpt-vis. Display relationships between entities with various layouts.
An organization chart component for @antv/gpt-vis. Visualize hierarchical organizational structures.
A radar chart component for @antv/gpt-vis. Display multidimensional data across four or more axes.
A sankey diagram component for @antv/gpt-vis. Show data flow between stages or categories.
A scatter chart component for @antv/gpt-vis. Show relationships between two variables with optional grouping.
A summary component for @antv/gpt-vis. Render rich text narratives with T8 markdown-like syntax.
A treemap chart component for @antv/gpt-vis. Display hierarchical data with nested rectangles.
A Venn diagram component for @antv/gpt-vis. Show set relationships and intersections.
A violin chart component for @antv/gpt-vis. Show data distribution density across categories.
A waterfall chart component for @antv/gpt-vis. Show cumulative effect of sequential positive and negative values.
A word cloud chart component for @antv/gpt-vis. Visualize word frequency by text size.
English | ็ฎไฝไธญๆ
GPT-Vis
AI-native visualization library for the LLM era. Framework-agnostic, ready to use.
๐ Documentation ยท ๐จ Examples ยท ๐ MCP Server ยท ๐งฉ Chart Skill
npm install @antv/gpt-vis
import { GPTVis } from '@antv/gpt-vis';
const gptVis = new GPTVis({
container: 'container',
width: 600,
height: 400,
});
gptVis.render({
type: 'line',
data: [
{ time: '2020', value: 100 },
{ time: '2021', value: 120 },
{ time: '2022', value: 150 },
],
});
Charts render as the AI model generates, no need to wait for the full response:
import { GPTVis, isVisSyntax } from '@antv/gpt-vis';
const gptVis = new GPTVis({ container: 'container', width: 600, height: 400 });
let buffer = '';
function onToken(token) {
buffer += token;
if (isVisSyntax(buffer)) {
gptVis.render(buffer);
}
}
render() supports two input formats: JSON objects (ideal for programmatic use) and DSL syntax (ideal for LLM streaming).
Pass JSON objects directly for programmatic chart creation:
Line chart:
gptVis.render({
type: 'line',
data: [
{ time: '2020', value: 100 },
{ time: '2021', value: 120 },
{ time: '2022', value: 150 },
],
});
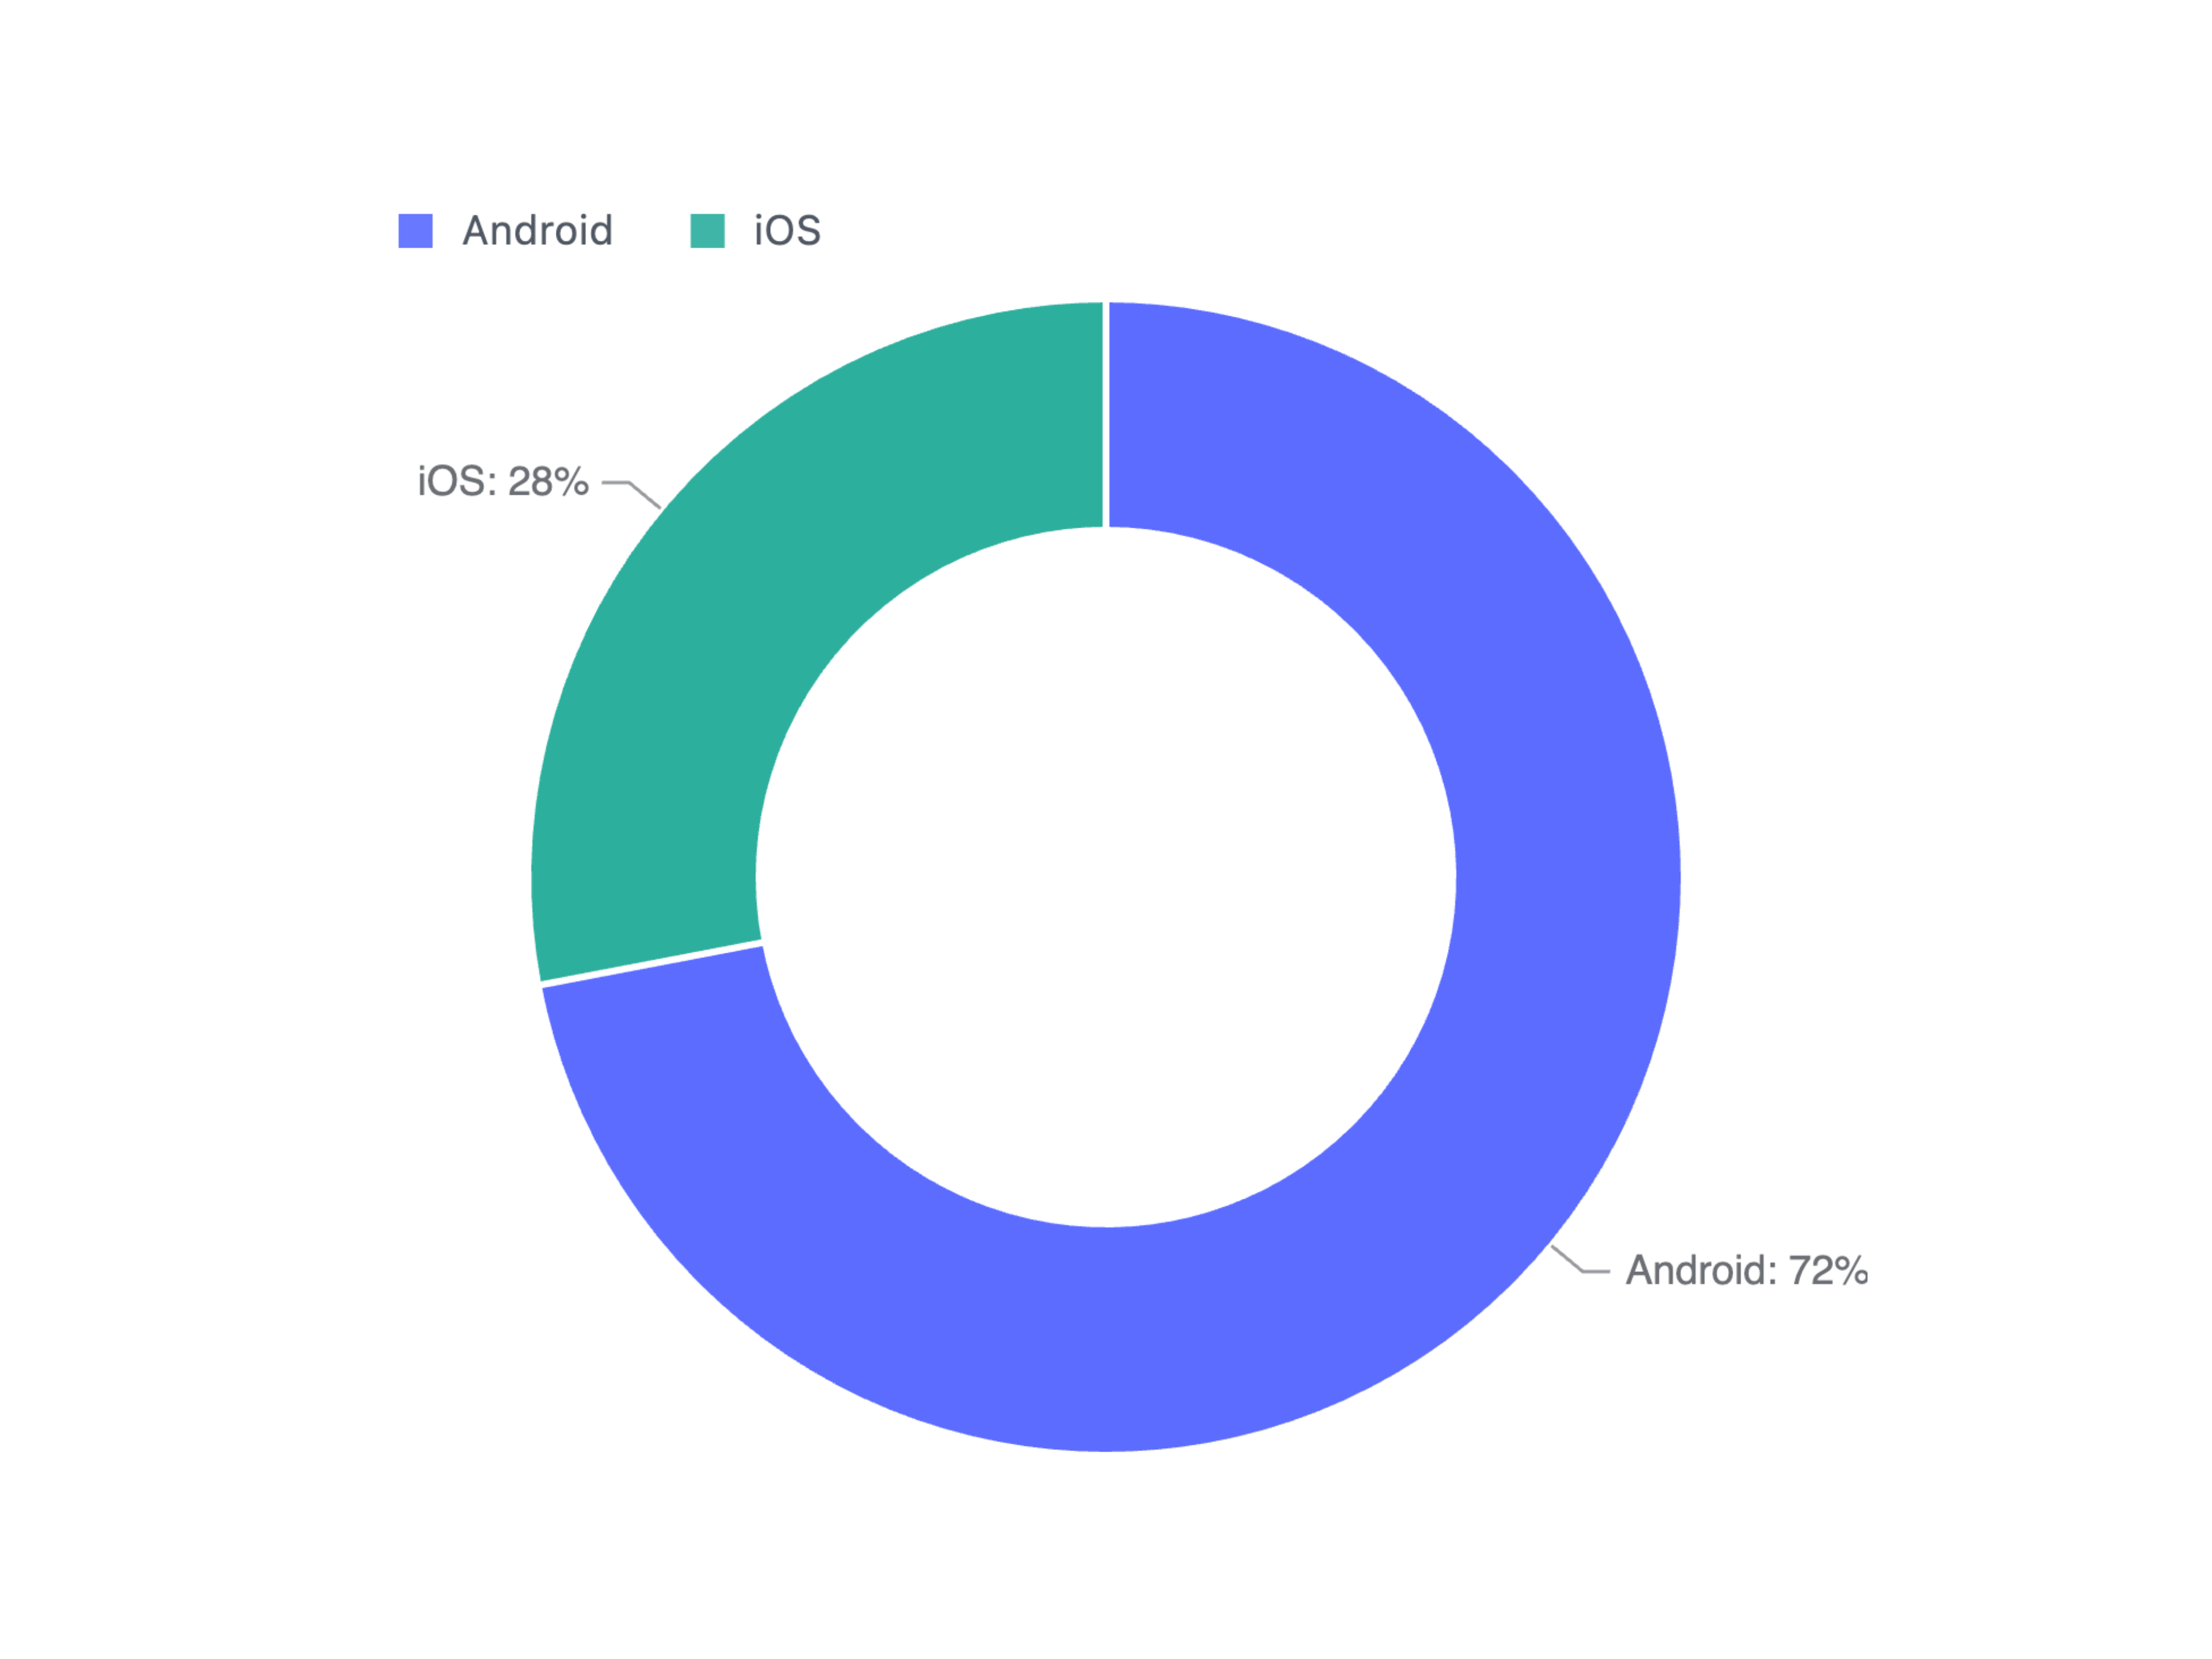
Pie chart:
gptVis.render({
type: 'pie',
data: [
{ category: 'Android', value: 72 },
{ category: 'iOS', value: 28 },
],
innerRadius: 0.6,
});
Themes:
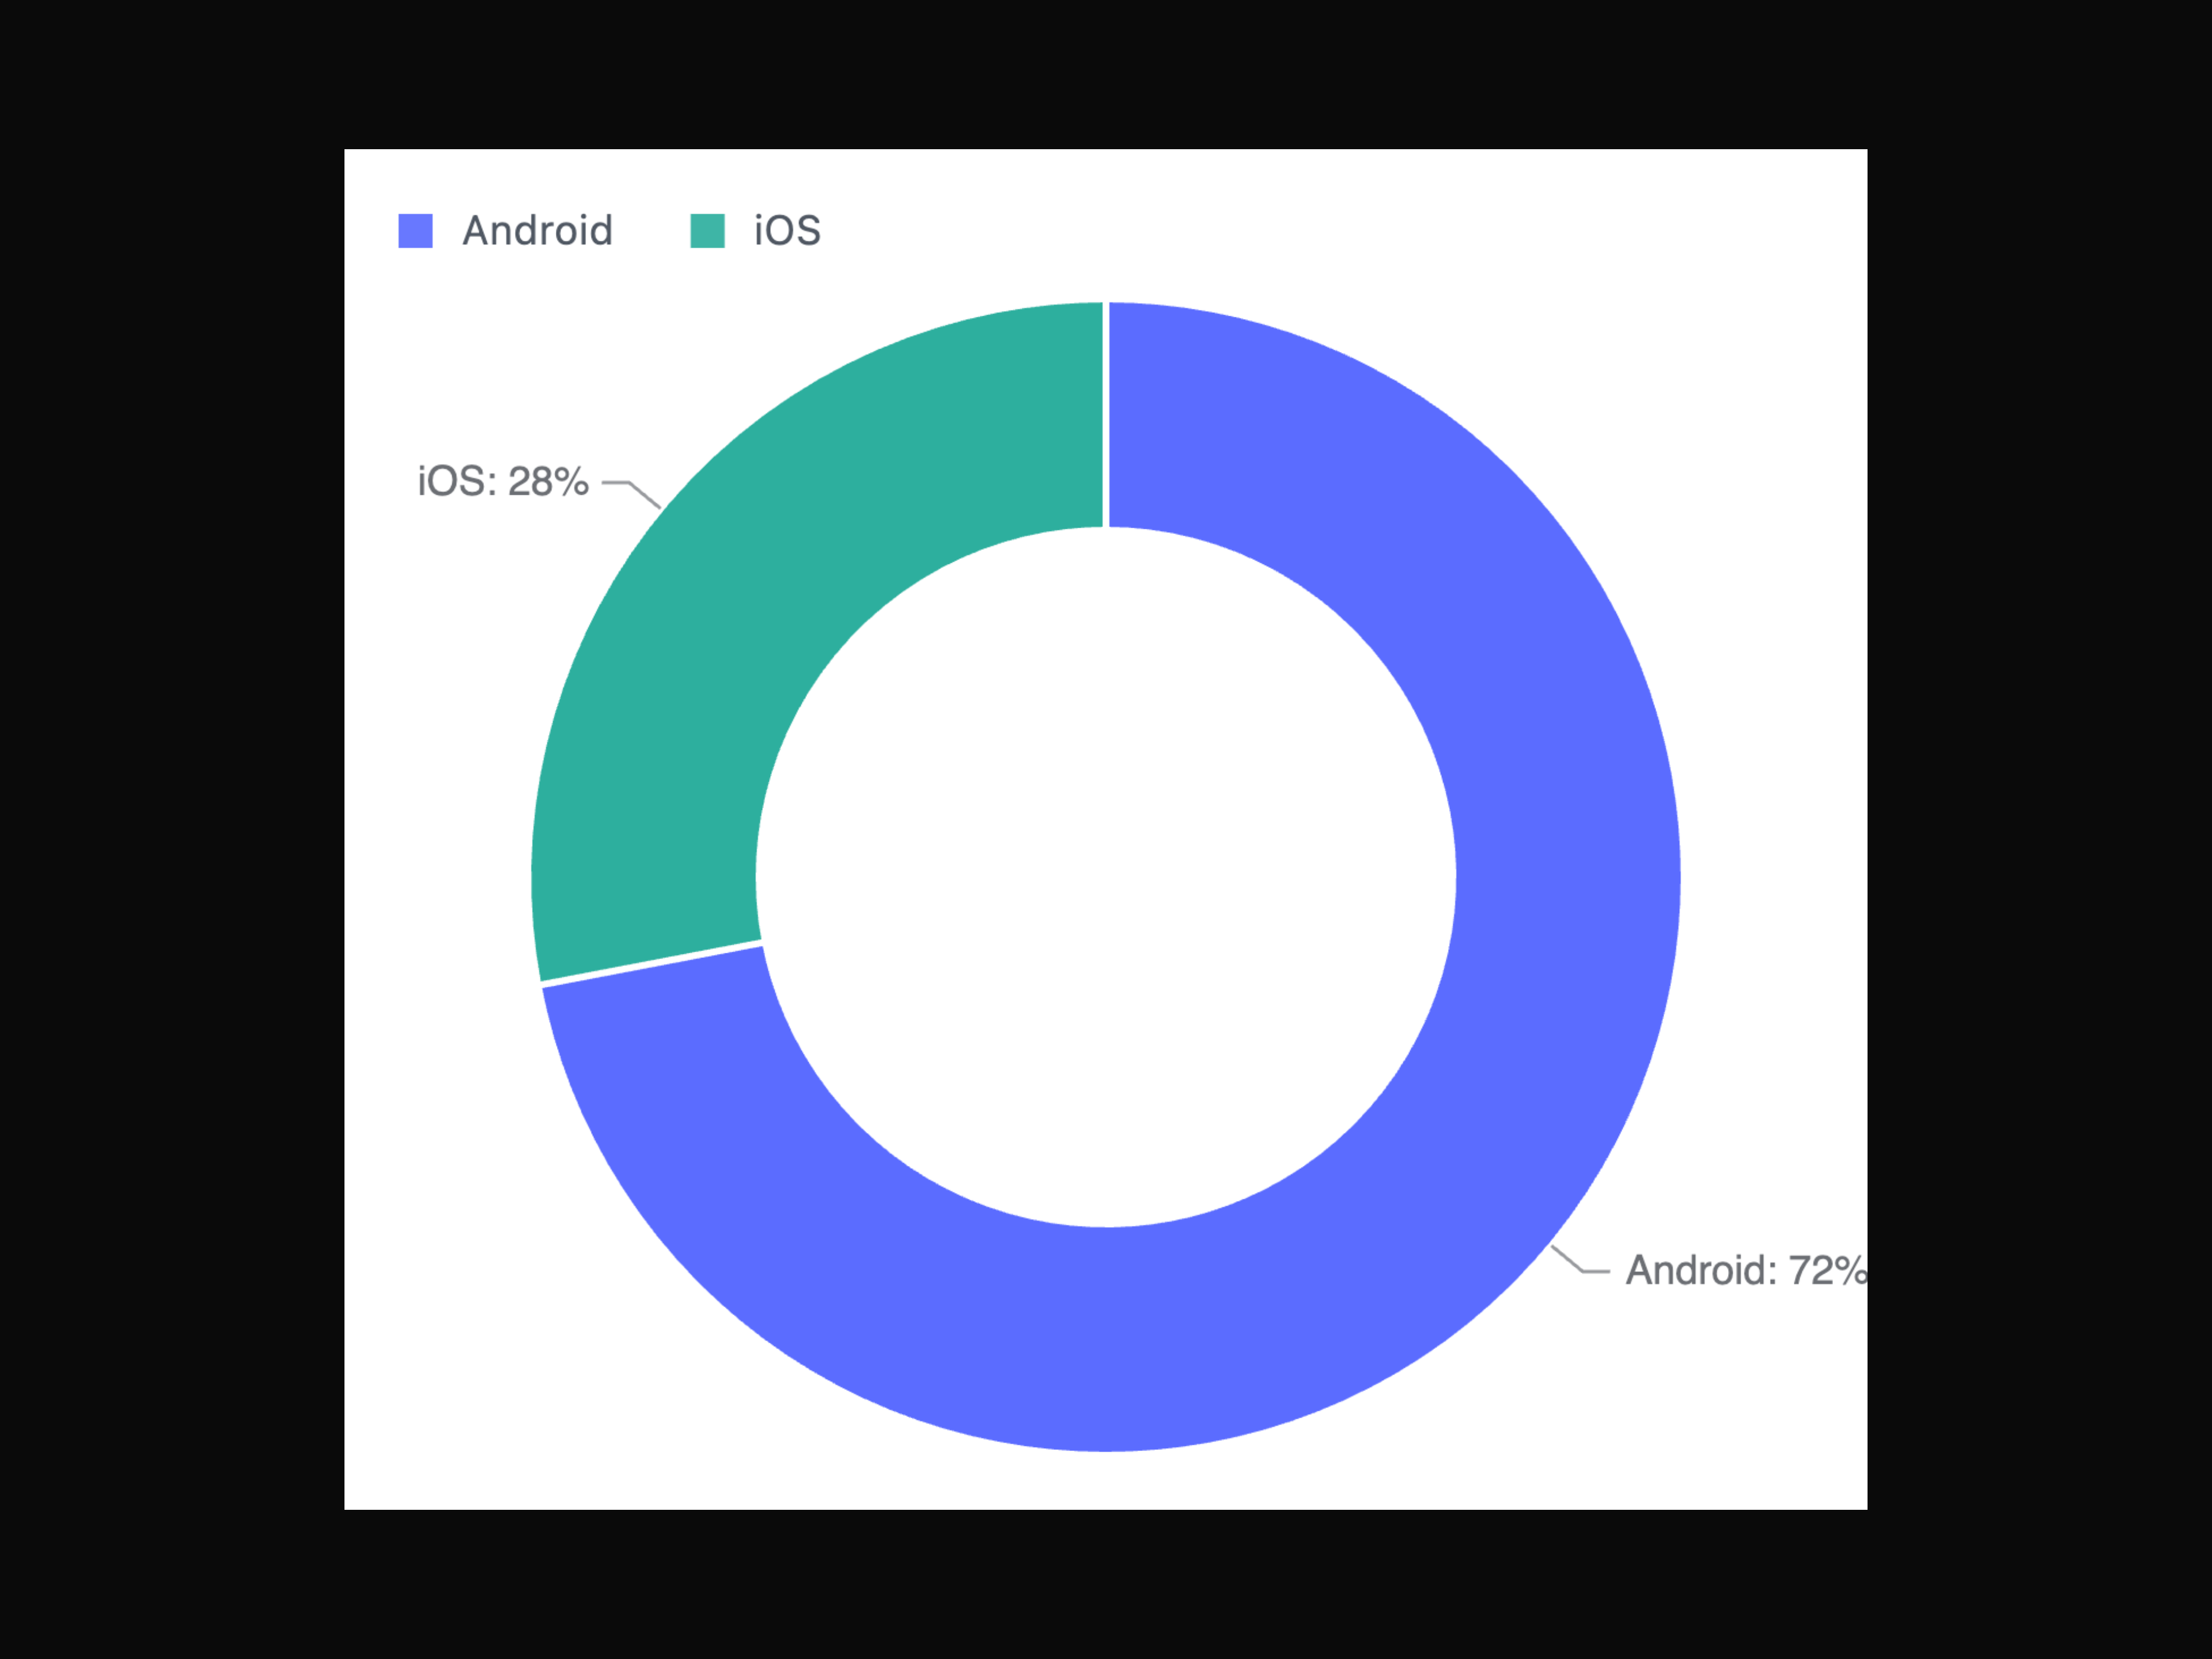
Three built-in themes, switchable via the theme property:
| Theme | Identifier | Background | Palette |
|---|---|---|---|
| Default (Light) | default | #FFF | #1783FF #F08F56 #D580FF #00C9C9 #7863FF ... |
| Dark | dark | #000 | #1783FF #F08F56 #D580FF #00C9C9 #7863FF ... |
| Academy | academy | #FFF | #4e79a7 #f28e2c #e15759 #76b7b2 #59a14f ... |
gptVis.render({
type: 'line',
data: [
{ time: '2020', value: 100 },
{ time: '2021', value: 120 },
],
theme: 'dark',
});
Custom Styles:
gptVis.render({
type: 'line',
data: [
{ time: '2020', value: 100 },
{ time: '2021', value: 120 },
],
style: { lineWidth: 3, palette: ['#5B8FF9', '#5AD8A6'] },
});
Declarative markdown-like syntax that LLMs can generate without learning complex APIs:
vis [chart-type]
[property] [value]
data
- [field] [value]
Pie chart:
vis pie
data
- category Sales
value 30
- category Marketing
value 25
innerRadius 0.6
Themes:
vis line
data
- time 2020
value 100
- time 2021
value 120
theme dark
Custom Styles:
Use style to set line width, custom palettes, and more:
vis line
data
- time 2020
value 100
- time 2021
value 120
style
lineWidth 3
palette
- #5B8FF9
- #5AD8A6
Quoted string values (for values with spaces):
vis pie
data
- category "Q1 Sales"
value 30
- category "Q2 Sales"
value 25
Hierarchical data:
vis mindmap
data
- name Project Plan
children
- name Phase 1
- name Phase 2
Render DSL syntax:
const visSyntax = `
vis line
data
- time 2020
value 100
- time 2021
value 120
- time 2022
value 150
`;
gptVis.render(visSyntax);
26 chart types covering statistical analysis, relationship networks, and text visualization.
| Chart | Type Identifier |
|---|---|
| Line | line |
| Area | area |
| Column | column |
| Bar | bar |
| Pie | pie |
| Scatter | scatter |
| Radar | radar |
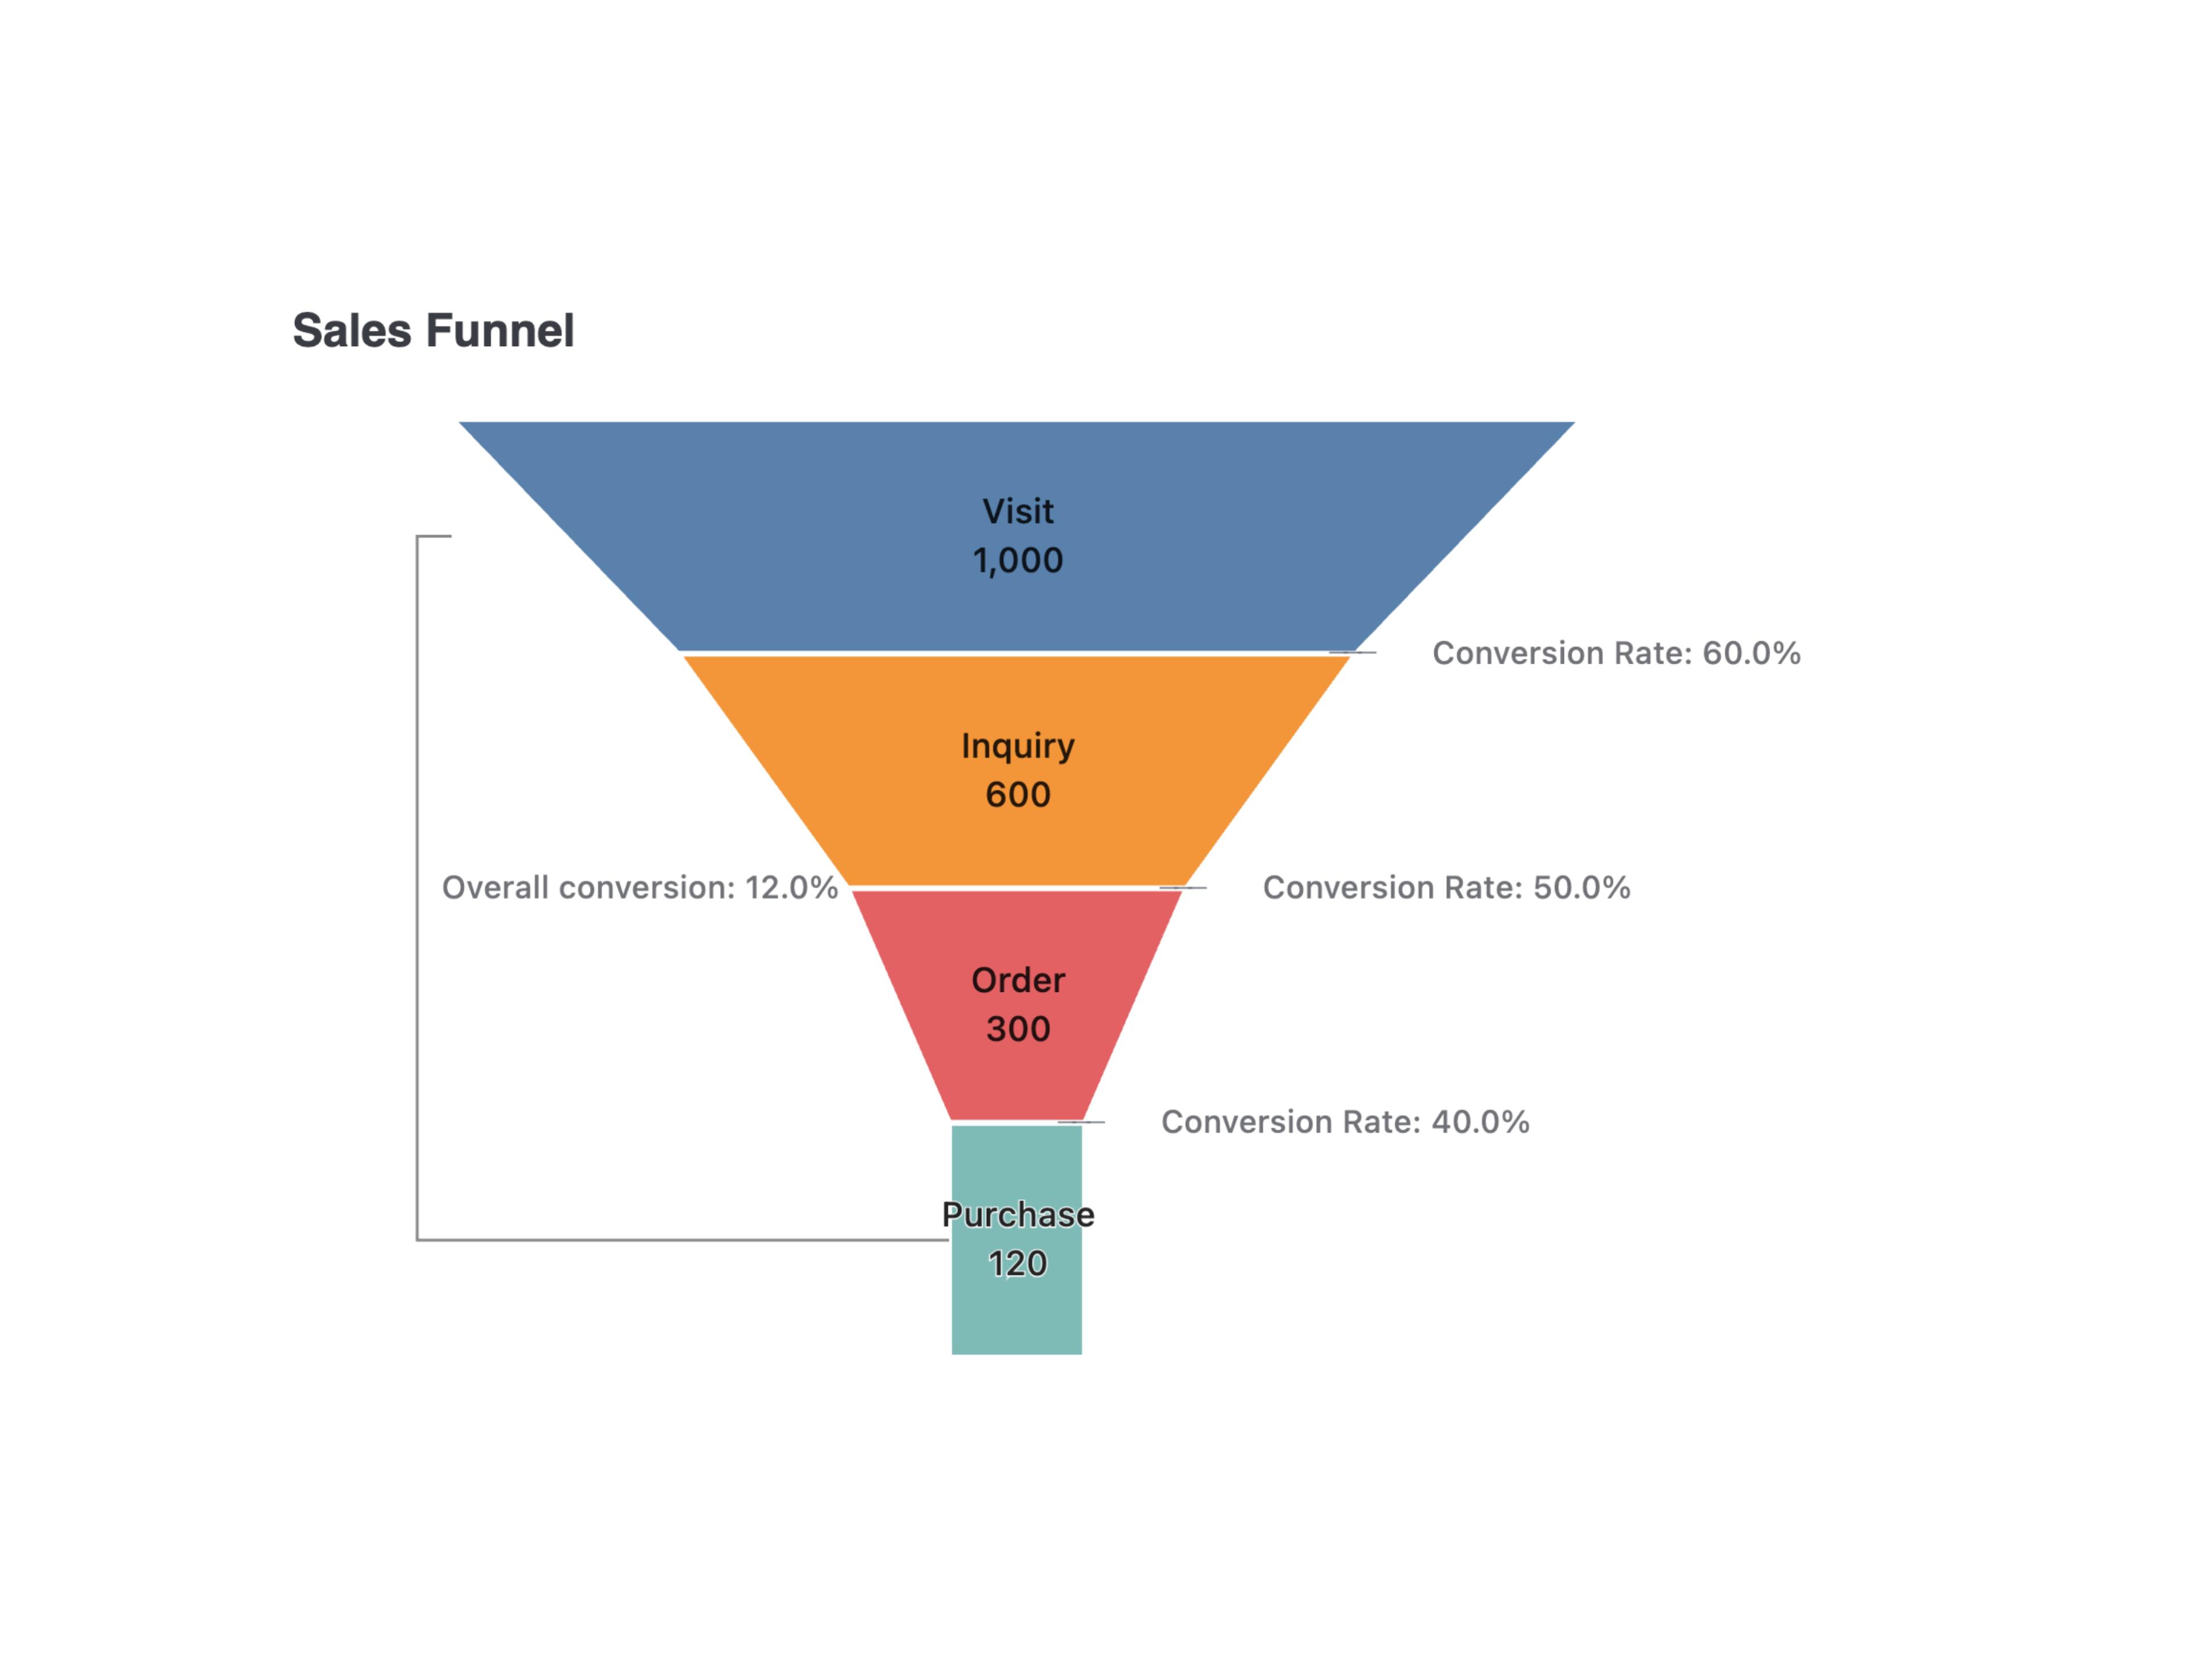
| Funnel | funnel |
| Waterfall | waterfall |
| Dual Axes | dual-axes |
| Histogram | histogram |
| Boxplot | boxplot |
| Violin | violin |
| Venn | venn |
| Sankey | sankey |
| Treemap | treemap |
| Word Cloud | word-cloud |
| Liquid | liquid |
| Chart | Type Identifier |
|---|---|
| Flow Diagram | flow-diagram |
| Network Graph | network-graph |
| Mindmap | mindmap |
| Indented Tree | indented-tree |
| Organization Chart | organization-chart |
| Fishbone Diagram | fishbone-diagram |
| Chart | Type Identifier |
|---|---|
| Table | table |
| Summary | summary |
Explore all examples โ Examples Gallery
Vanilla JavaScript
import { GPTVis } from '@antv/gpt-vis';
const gptVis = new GPTVis({ container: 'chart', width: 600, height: 400 });
gptVis.render(visSyntaxString);
React
import { GPTVis } from '@antv/gpt-vis';
import { useEffect, useRef } from 'react';
function ChartComponent({ visSyntax }) {
const containerRef = useRef();
const gptVisRef = useRef();
useEffect(() => {
gptVisRef.current = new GPTVis({ container: containerRef.current, width: 600, height: 400 });
return () => gptVisRef.current?.destroy();
}, []);
useEffect(() => {
if (gptVisRef.current && visSyntax) {
gptVisRef.current.render(visSyntax);
}
}, [visSyntax]);
return ;
}
Vue
import { ref, watch, onUnmounted } from 'vue';
import { GPTVis } from '@antv/gpt-vis';
const props = defineProps(['visSyntax']);
const chartRef = ref(null);
let gptVis = null;
watch(
() => props.visSyntax,
(syntax) => {
if (!gptVis) {
gptVis = new GPTVis({ container: chartRef.value, width: 600, height: 400 });
}
gptVis.render(syntax);
},
{ immediate: true },
);
onUnmounted(() => gptVis?.destroy());
Markdown Renderer (marked)
GPT-Vis syntax naturally works with Markdown code fences and integrates with any Markdown renderer. The following example uses marked + marked-highlight โ normal code blocks get syntax highlighting, while vis code blocks are rendered as interactive charts.
Install dependencies:
npm install @antv/gpt-vis marked marked-highlight highlight.js
Complete example:
import { Marked } from 'marked';
import { markedHighlight } from 'marked-highlight';
import hljs from 'highlight.js';
import { GPTVis } from '@antv/gpt-vis';
class GPTVisElement extends HTMLElement {
connectedCallback() {
const syntax = decodeURIComponent(this.dataset.syntax);
this._instance = new GPTVis({ container: this });
this._instance.render(syntax);
}
disconnectedCallback() {
this._instance?.destroy();
}
}
if (!customElements.get('gpt-vis')) {
customElements.define('gpt-vis', GPTVisElement);
}
const marked = new Marked(
markedHighlight({
langPrefix: 'hljs language-',
highlight(code, lang) {
if (lang?.startsWith('vis')) return code;
const language = hljs.getLanguage(lang) ? lang : 'plaintext';
return hljs.highlight(code, { language }).value;
},
}),
{
renderer: {
code({ text, lang }) {
if (lang?.startsWith('vis')) {
const syntax = encodeURIComponent(lang + '\n' + text);
return ``;
}
return false;
},
},
},
);
const markdown = `# My Report
\`\`\`vis bar
data
- category Python
value 28.1
- category JavaScript
value 18.5
- category Java
value 15.6
- category "C/C++"
value 12.3
title 2024 Programming Language Popularity
\`\`\`
`;
document.getElementById('content').innerHTML = marked.parse(markdown);
Copy GPT-Vis React components directly into your project via shadcn CLI โ full source control, fully customizable.
The universal GPTVis component accepts vis syntax strings or config objects for all 26 chart types:
npx shadcn@latest add @gpt-vis/gpt-vis
import { GPTVis } from '@/components/ui/gpt-vis';
;
Each chart type has its own component with a typed config prop โ JSON only, chart-specific TypeScript validation:
npx shadcn@latest add @gpt-vis/line
import { Line } from '@/components/ui/line';
;
All 26 chart types are available. Install any by name:
npx shadcn@latest add @gpt-vis/pie
npx shadcn@latest add @gpt-vis/bar
npx shadcn@latest add @gpt-vis/mindmap
# ...and more
Each typed component automatically bundles the base GPTVis component as a dependency. Props like width, height, theme, wrapper, locale, className, and containerStyle are the same across all components.
GPT-Vis provides a complete AI integration solution:
AI-Generated Code Policy: This project only merges AI-generated code.
MIT ยฉ AntV
gpt-vis is a component library on 21st.dev by gpt-vis with 2 public React components. Every component ships with a live interactive preview and full TSX source โ copy the code, install it through the shadcn CLI, or pull it into Cursor or Claude Code over MCP.