HomeBookmarks
BklitBklit
Bklit

Bklit

React component library of design-engineered charts and data-visualization components.

BKby bklitai
29components192.8Kviews2.1Kbookmarks

Installs all 43 components. Without our CLI, run instead.

Auto-indexed

Bklit contents
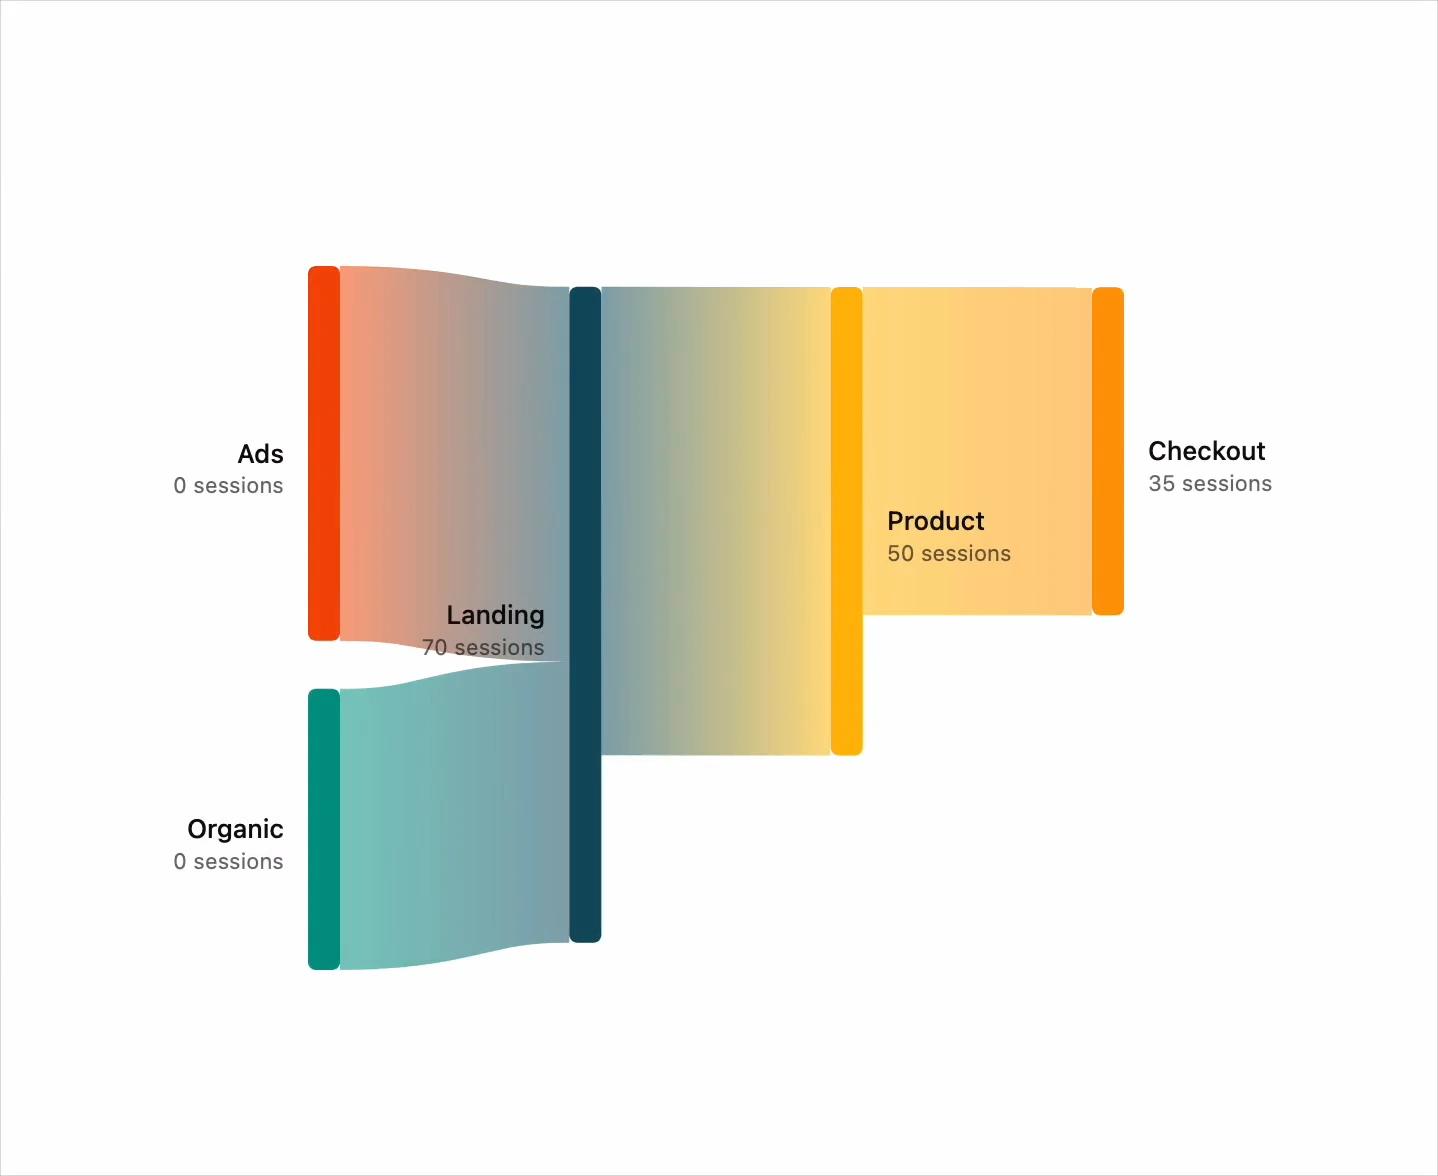
  • Sankey Diagram

    Sankey Diagram

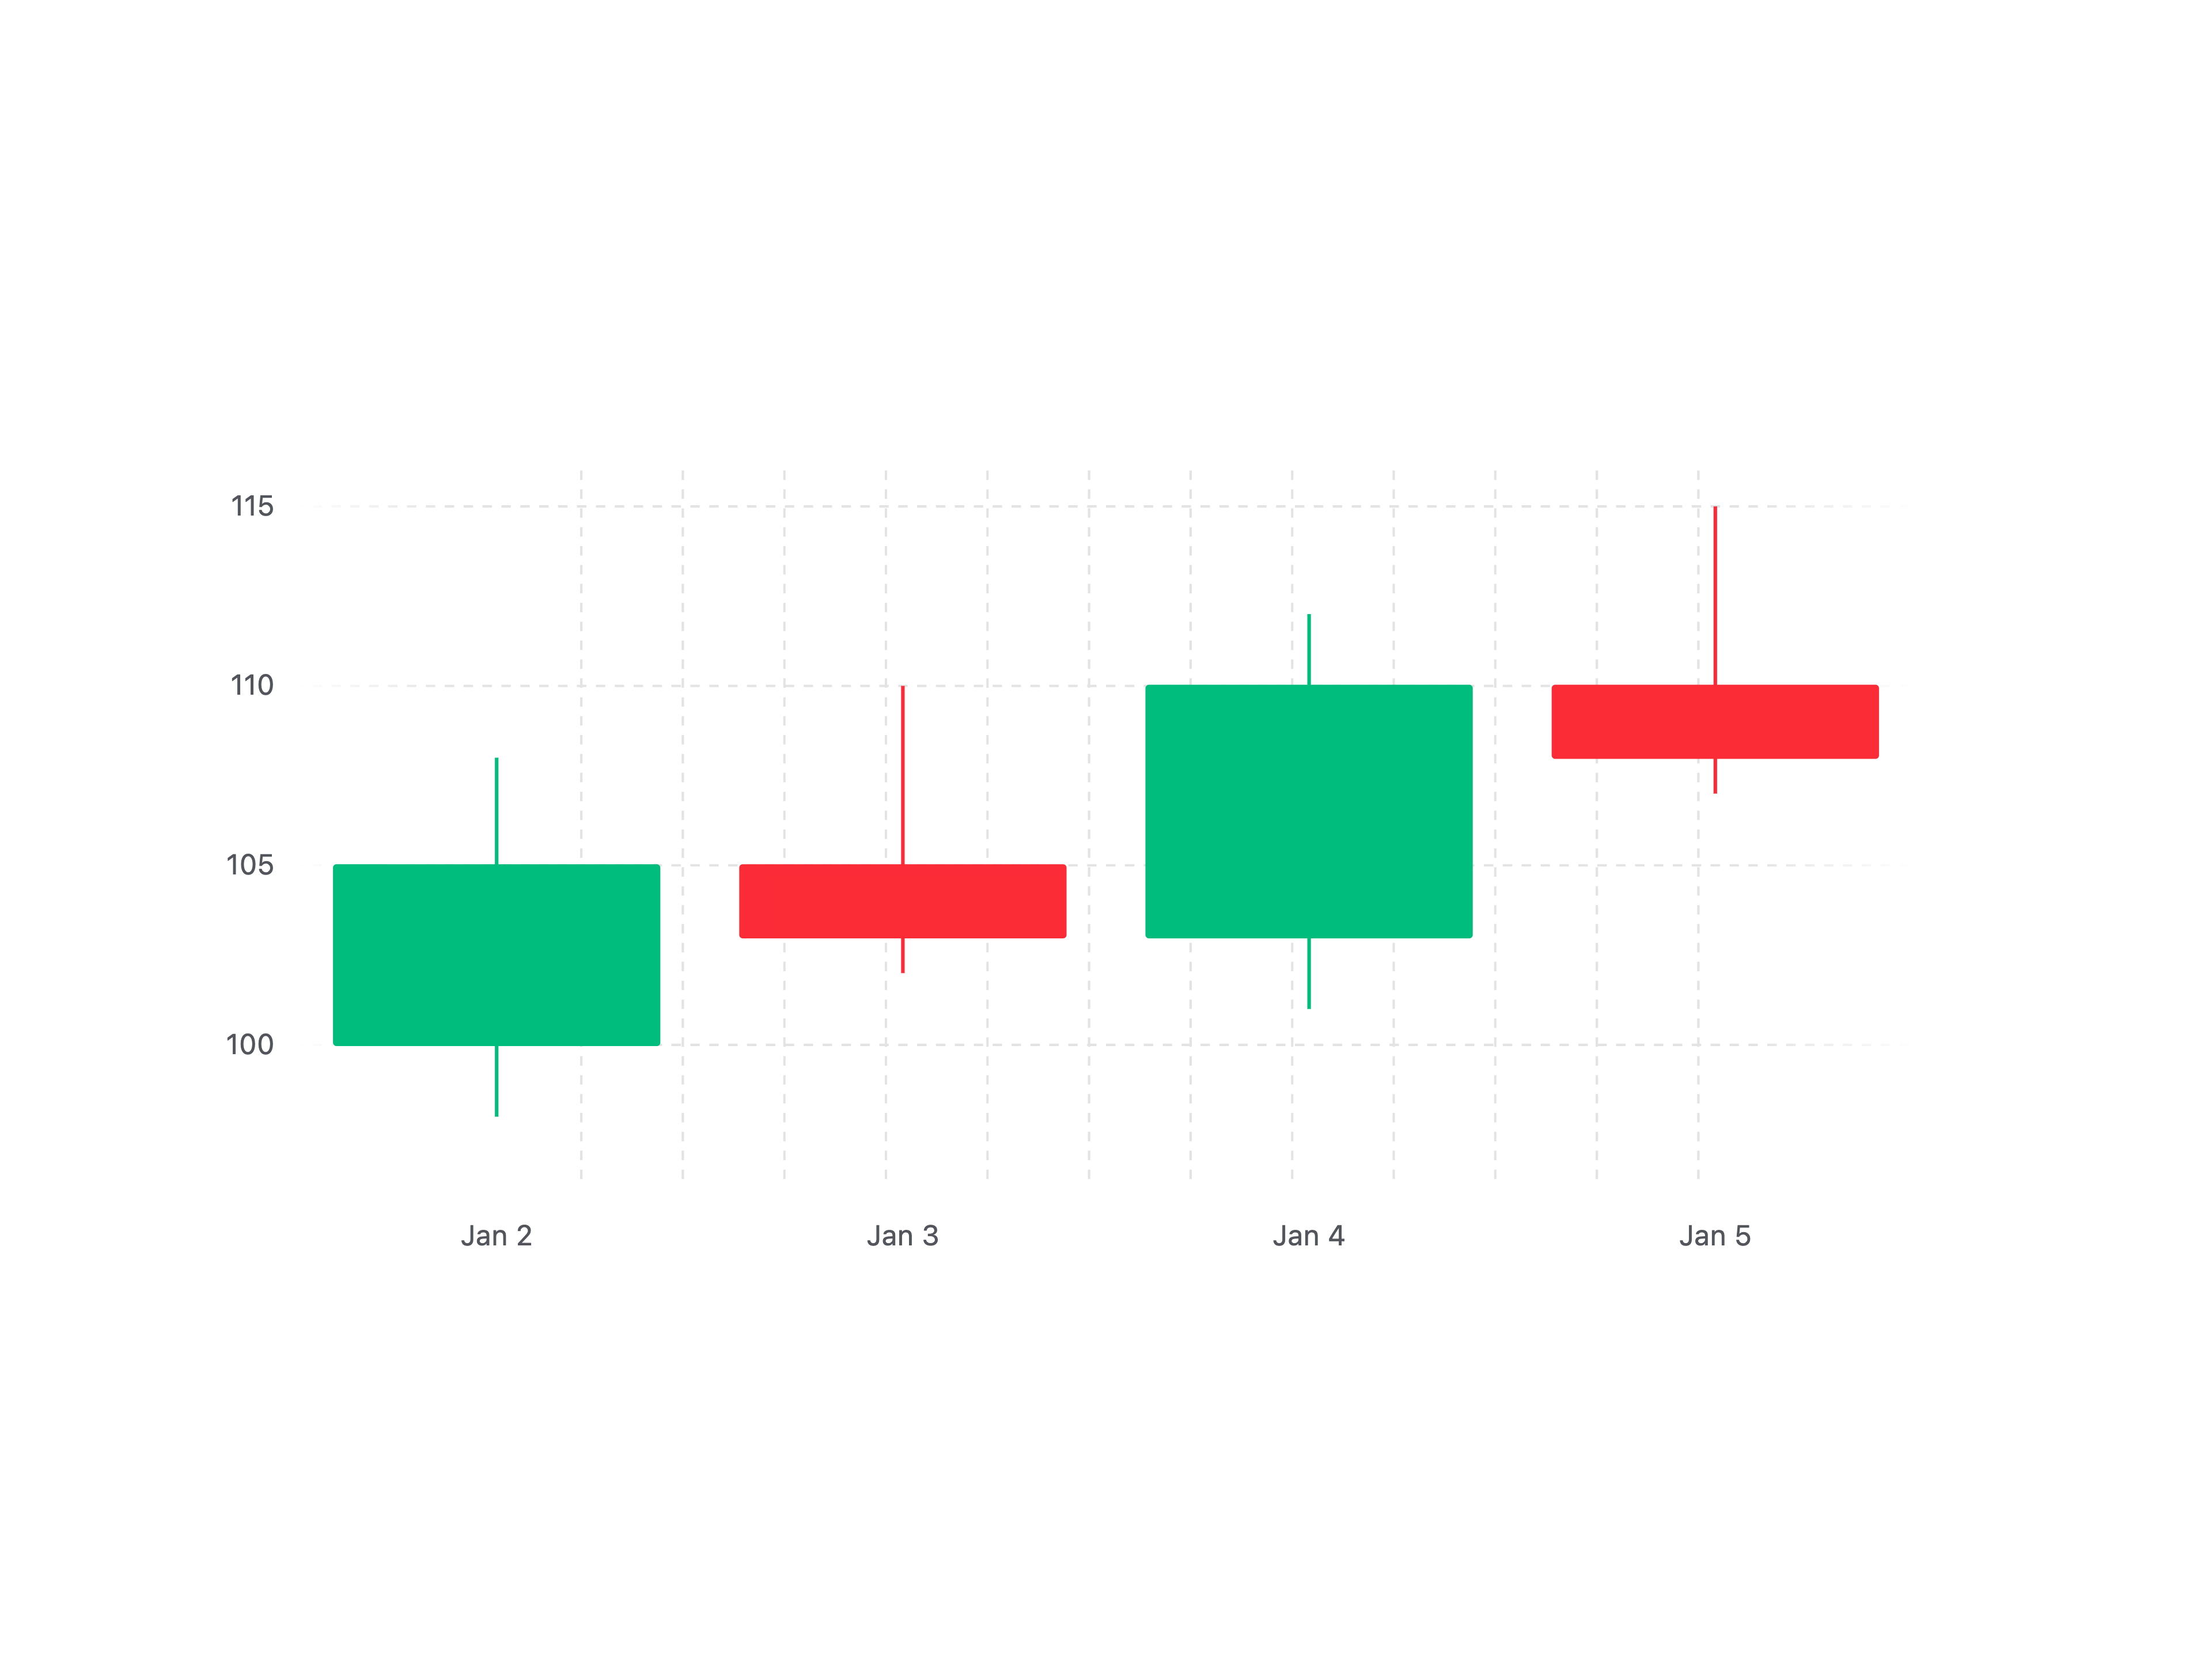
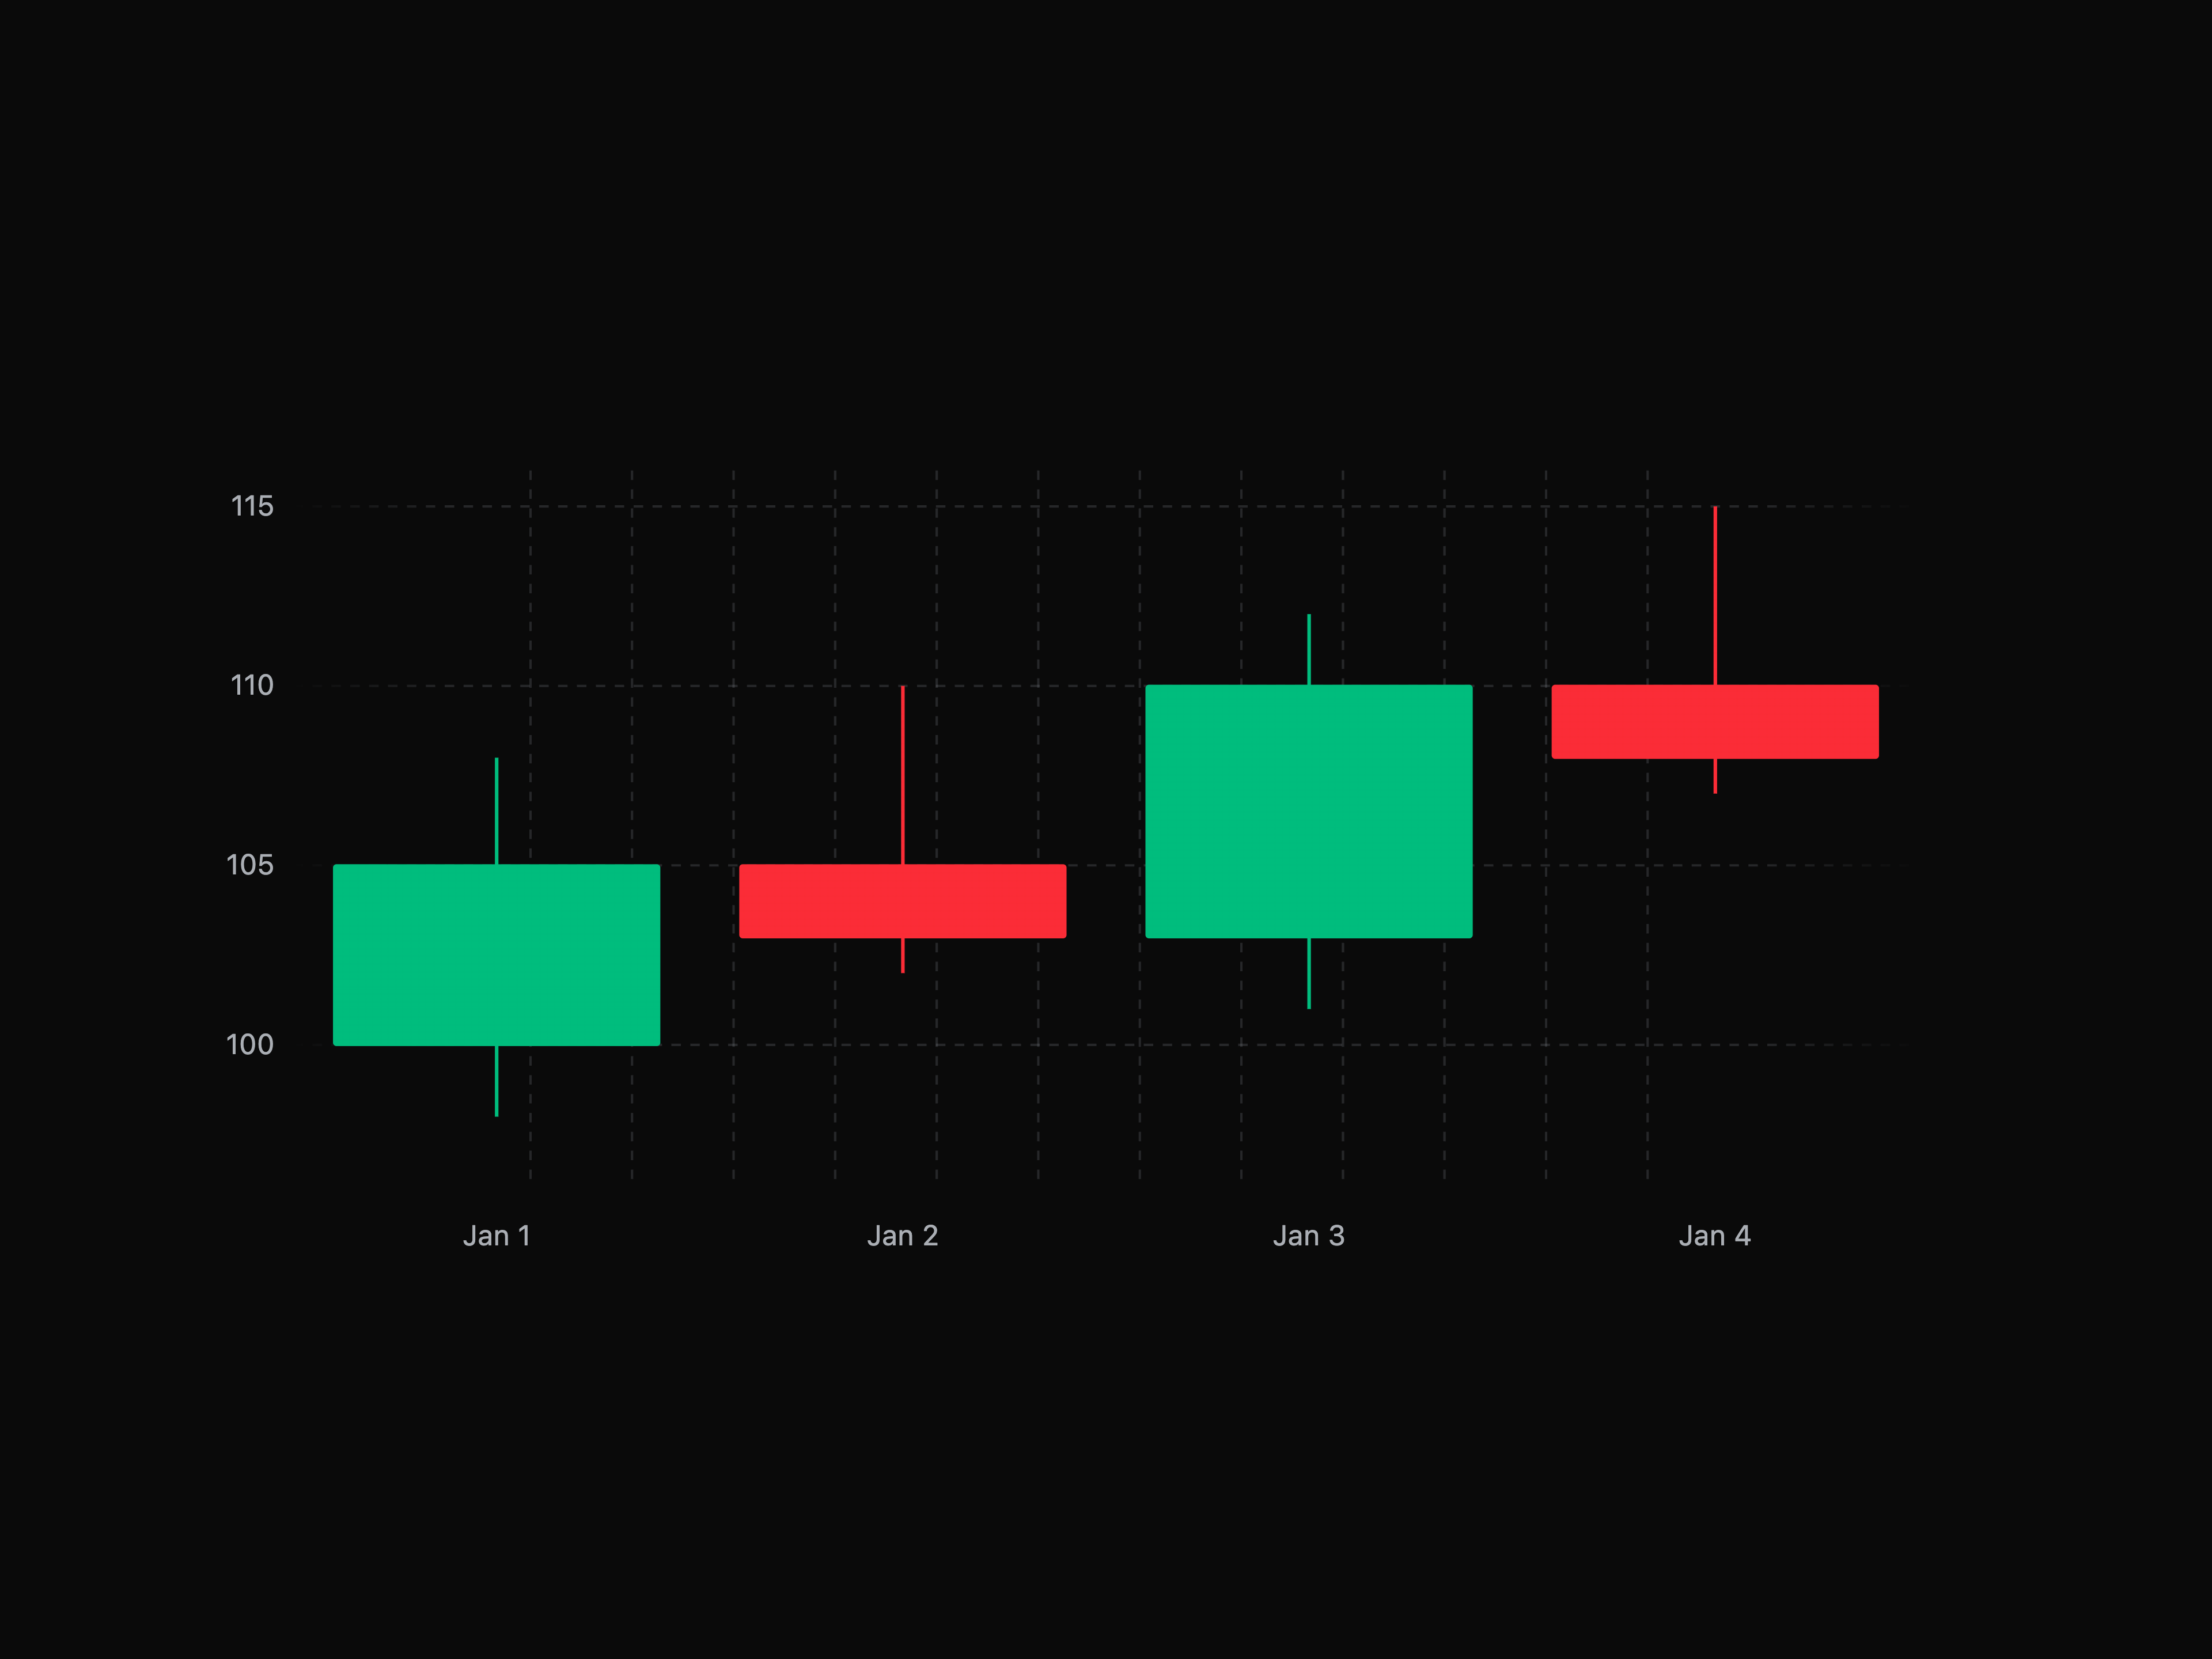
  • Candlestick ChartCandlestick Chart

    Candlestick Chart

  • Funnel Chart

    Funnel Chart

  • Funnel Chart

    Funnel Chart

  • Funnel Chart

    Funnel Chart

  • Funnel Chart

    Funnel Chart

  • Funnel Chart

    Funnel Chart

  • Funnel Chart

    Funnel Chart

  • Funnel Chart

    Funnel Chart

  • Bar Chart

    Bar Chart

  • Bar Chart

    Bar Chart

  • Bar Chart

    Bar Chart

  • Bar Chart

    Bar Chart

  • Bar Chart

    Bar Chart

  • Bar Chart

    Bar Chart

  • Bar Chart

    Bar Chart

  • Bar Chart

    Bar Chart

  • Bar Chart

    Bar Chart

  • Bar Chart

    Bar Chart

  • Area Chart

    Area Chart

  • Area Chart

    Area Chart

  • Area Chart

    Area Chart

  • Area Chart

    Area Chart

  • Area Chart

    Area Chart

  • About Bklit

    Bklit publishes a shadcn registry at ui.bklit.com, with 43 components installable through the shadcn CLI.

    Components
    43
    GitHub stars
    1,967
    Last commit
    Nov 11, 2026
    Repository
    bklit/bklit-ui

    Also in the Bklit registry

    Copy a prompt for your agent, copy the install command, or open the docs that ship it.

    • Chart Background

      background

      Pattern fill for the plot area when grid lines are hidden

      @visx/pattern@4.0.1-alpha.0, motion3 files
      Docs ↗
    • band

    • Bar Depth

      bar-depth

      3D depth and glossy glass surfaces for BarChart bars

      motion1 file
    • Chart Animation

      chart-animation

      Shared motion helpers for chart enter transitions, clip reveals, and staggered animations

      motion7 files
    • Chart Context

      chart-context

      Shared context and hooks for Bklit chart components

      @visx/event@4.0.1-alpha.0, @visx/responsive@4.0.1-alpha.0, @visx/scale@4.0.1-alpha.0, d3-array12 files
    • chart-crosshair

    • chart-parent-size

    • Chart Series Layer

      chart-series

      Shared line and area series rendering helpers (paths, markers, highlights, dash tails)

      @visx/shape@4.0.1-alpha.0, d3-shape, motion15 files
    • Chart Stat Flow

      chart-stat-flow

      Animated stat value and label for chart overlays

      @number-flow/react, motion1 file
    • Chart Tooltip

      chart-tooltip

      Composable tooltip components for charts

      @number-flow/react, motion9 files
    • Choropleth Map

      choropleth-chart

      A geographic map chart with zoom, pan, and data visualization

      @types/geojson, @visx/geo@4.0.1-alpha.0, @visx/responsive@4.0.1-alpha.0, @visx/zoom@4.0.1-alpha.07 files2 examples
      Docs ↗
    • Composed Chart

      composed-chart

      Time-series chart composing Line, Area, and SeriesBar on one shared scale (Recharts ComposedChart-style)

      @visx/curve@4.0.1-alpha.0, @visx/scale@4.0.1-alpha.0, @visx/shape@4.0.1-alpha.0, @visx/responsive@4.0.1-alpha.08 files1 example
      Docs ↗
    • deadline

    • Gauge

      gauge-chart

      Notch-based radial or linear gauge with optional center label, patterns, and optional gradients

      @visx/responsive@4.0.1-alpha.0, @visx/pattern@4.0.1-alpha.0, @number-flow/react, motion8 files1 example
      Docs ↗
    • gradients

    • Chart Grid

      grid

      Grid lines for charts

      @visx/grid@4.0.1-alpha.02 files
      Docs ↗
    • Heatmap Chart

      heatmap-chart

      A contribution heatmap with animated cells and configurable level colors

      @visx/group@4.0.1-alpha.0, @visx/heatmap@4.0.1-alpha.0, @visx/pattern@4.0.1-alpha.0, @visx/responsive@4.0.1-alpha.022 files1 example
      Docs ↗
    • Chart Legend

      legend

      Composable legend components for charts

      @base-ui/react, @number-flow/react8 files
      Docs ↗
    • Line Chart

      line-chart

      A composable line chart with multiple series support

      @visx/curve@4.0.1-alpha.0, @visx/shape@4.0.1-alpha.0, motion16 files1 example
      Docs ↗
    • Live Line Chart

      live-line-chart

      Real-time streaming line chart with smooth scrolling, crosshair, and animated axes

      @visx/curve@4.0.1-alpha.0, @visx/scale@4.0.1-alpha.0, @visx/shape@4.0.1-alpha.0, @visx/responsive@4.0.1-alpha.05 files1 example
      Docs ↗
    • Chart Markers

      markers

      Marker components for highlighting data points on charts

      utils3 files
    • native-charts

    • patterns

      utils
    • Pie Chart

      pie-chart

      A composable pie chart with animations and customizable slices

      @number-flow/react, @visx/group@4.0.1-alpha.0, @visx/responsive@4.0.1-alpha.0, @visx/shape@4.0.1-alpha.07 files1 example
      Docs ↗
    • Profit/Loss Line

      profit-loss-line

      Sign-colored line segments for profit and loss on LineChart

      @visx/curve@4.0.1-alpha.0, @visx/shape@4.0.1-alpha.04 files
      Docs ↗
    • Projection Line

      projection-line

      Forecast segment extending a line series past the last data point

      @visx/shape@4.0.1-alpha.0, motion4 files
      Docs ↗
    • Radar Chart

      radar-chart

      A composable radar/spider chart with multiple data series

      @visx/group@4.0.1-alpha.0, @visx/responsive@4.0.1-alpha.0, @visx/scale@4.0.1-alpha.0, @visx/shape@4.0.1-alpha.06 files1 example
      Docs ↗
    • radial-chart

      utils1 example
    • Reference Area

      reference-area

      Shaded data-coordinate band for target ranges and thresholds on time-series charts

      motion3 files
      Docs ↗
    • Ring Chart

      ring-chart

      A composable donut/ring chart with progress indicators

      @visx/group@4.0.1-alpha.0, @visx/responsive@4.0.1-alpha.0, @visx/shape@4.0.1-alpha.0, @number-flow/react6 files1 example
      Docs ↗
    • Scatter Chart

      scatter-chart

      A composable time-series scatter chart with offset rings, hover dimming, and animated enter

      d3-array, d3-scale, motion, react-use-measure11 files1 example
      Docs ↗
    • Shimmering Text

      shimmering-text

      Per-character shimmer animation for loading labels and badges

      motion1 file
    • sparkline

      utils3 examples
    • Sunburst Chart

      sunburst-chart

      A composable hierarchical sunburst chart with drill-down zoom and animated segments

      motion9 files1 example
    • trend-line

    • weekends

    • X Axis

      x-axis

      X-axis component for time-series charts

      utils1 file
      Docs ↗
    • Y Axis

      y-axis

      Y-axis component for value labels in line and area charts

      utils2 files
      Docs ↗

    From the Bklit readme

    A collection of Open Source charts and utility components that you can customize and extend.


    Sponsors

    Bklit UI is supported by our sponsors. Become a sponsor.

    Premium sponsors: OpenPanel

    OpenPanel — OpenPanel is an open source analytics platform that combines web analytics and product analytics in one privacy-first tool. Track pageviews, events, funnels, retention, and user journeys — all without cookies.

    Silver sponsors: UI Rules, shadcn studio, pug

    Charts

      Area Chart
      Docs · Studio


      Bar Chart
      Docs · Studio


      Candlestick Chart
      Docs · Studio


      Choropleth Chart
      Docs · Studio


      Composed Chart
      Docs · Studio


      Funnel Chart
      Docs · Studio


      Gauge
      Docs · Studio


      Heatmap Chart
      Docs · Studio


      Line Chart
      Docs · Studio


      Live Line Chart
      Docs · Studio


      Pie Chart
      Docs · Studio


      Profit/Loss Line
      Docs · Studio


      Radar Chart
      Docs · Studio


      Radial Chart
      Docs · Studio


      Ring Chart
      Docs · Studio


      Sankey Chart
      Docs · Studio


      Scatter Chart
      Docs · Studio


      Sparkline
      Docs · Studio


      Sunburst Chart
      Docs · Studio


    Studio

    Studio is Bklit's interactive chart playground. Pick a chart, tweak styling and animation controls in real time, then copy the generated React code or export a registry JSON for your project.

    Open Studio →

    Getting Started

    Bklit UI is a shadcn registry. Initialize shadcn in your project, then add a chart:

    npx shadcn@latest init
    npx shadcn@latest add @bklit/line-chart
    

    See Installation for registry setup and all components.

    React Native (beta)

    The line and area charts also run in React Native and Expo. They use the same components and props as the web charts, drawn with React Native Skia and animated on the UI thread with Reanimated: one-finger scrubbing, two-finger range selection, springs, morphs and the rolling date pill.

      Try it on your phone
      On Android, scan the code with your camera or open the install page, then tap Install. iPhone: coming soon on TestFlight.
    

    Add the charts to an Expo app (with a components.json in the project root):

    npx shadcn@latest add @bklit/native-charts
    

    In an Expo project the CLI installs Skia, Reanimated and Gesture Handler with npx expo install, so you get versions that match your SDK. See the React Native guide for step-by-step setup.

    Contributors can run the demo app (apps/mobile, Node 22+) with pnpm dev:mobile and open it in Expo Go. See apps/mobile/README.md for publishing the demo builds.

    Repo activity

    License

    Chart components (packages/ui, packages/native, shadcn registry) are MIT licensed.

    Bklit Studio (packages/studio, hosted at ui.bklit.com/studio) is proprietary. See LICENSE-STUDIO.md. You may not reuse, resell, or redistribute Studio without written permission.

    Read the rest on GitHub →

    What Bklit builds on

    The packages and primitives its components pull in, counted across the registry.

    utils28chart-utils6badge3card3

    What Bklit shipped recently

    Every appearance and removal our crawl has seen in the registry index.

    • chart-crosshairaddedNov 8, 2026
    • native-chartsaddedNov 8, 2026
    • gradientsaddedOct 31, 2026
    • radial-chartaddedOct 31, 2026
    • radial-chart-exampleaddedOct 31, 2026
    • sparklineaddedOct 24, 2026
    • sparkline-exampleaddedOct 24, 2026
    • deadlineaddedOct 22, 2026
    • weekendsaddedOct 22, 2026
    • bandaddedOct 20, 2026
    • trend-lineaddedOct 20, 2026

    Registries like Bklit

    Evil Charts

    Evil Charts

    by Legion Dev

    13

    components

    Pace UI

    Pace UI

    by Pace UI

    12

    components

    Nimbus UI

    Nimbus UI

    by Guglielmo Giannattasio

    3

    components

    Browse every shadcn registry we track →

    chart-parent-size
    added
    Oct 14, 2026
  • patternsaddedOct 14, 2026
    1. Components
    2. /
    3. bklitai
    4. /
    5. Bklit

    Related libraries

    FR

    Freedom

    by Dhileep Kumar GM

    215

    components

    Efferd

    Efferd

    by Efferd

    115

    components

    Agent Elements

    Agent Elements

    by 21st

    22

    components

    Be UI

    Be UI

    by Saurabh Chauhan

    72

    components

    vizcn · by vibecoding.tech

    vizcn · by vibecoding.tech

    by Eugene Shilow

    17

    components

    visx

    visx

    by Airbnb

    29

    components

    About Bklit

    Bklit is a component library on 21st.dev by bklitai with 5 public React components. Every component ships with a live interactive preview and full TSX source — copy the code, install it through the shadcn CLI, or pull it into Cursor or Claude Code over MCP.

    All 5 Bklit components

    • Area Chart
    • Bar Chart
    • Candlestick Chart
    • Funnel Chart
    • Sankey Diagram

    Browse all component libraries →