"use client";

import CandlestickChart from "@/components/ui/candlestick-chart";
import Candlestick from "@/components/ui/candlestick-chart-utils/candlestick";
import Grid from "@/components/ui/candlestick-chart-utils/grid";
import XAxis from "@/components/ui/candlestick-chart-utils/x-axis";
import YAxis from "@/components/ui/candlestick-chart-utils/y-axis";
import ChartTooltip from "@/components/ui/candlestick-chart-utils/chart-tooltip";

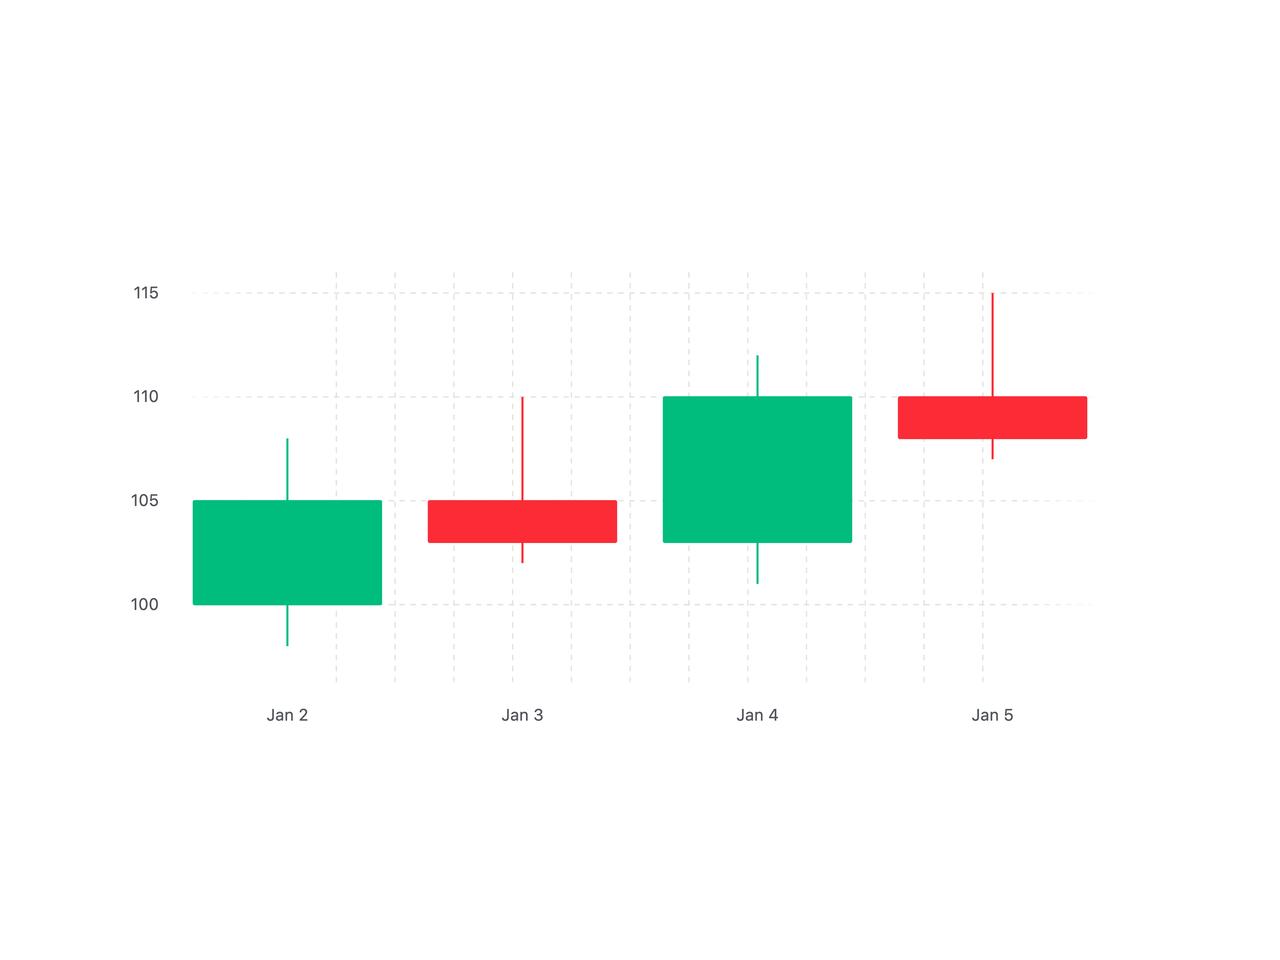
const ohlcData = [
  { date: new Date("2024-01-02"), open: 100, high: 108, low: 98, close: 105 },
  { date: new Date("2024-01-03"), open: 105, high: 110, low: 102, close: 103 },
  { date: new Date("2024-01-04"), open: 103, high: 112, low: 101, close: 110 },
  { date: new Date("2024-01-05"), open: 110, high: 115, low: 107, close: 108 },
];

export default function Component() {
  return (
    <main className="flex min-h-svh w-full items-center justify-center p-6 md:p-10">
      <div className="w-full max-w-3xl">
        <CandlestickChart data={ohlcData}>
          <Grid horizontal vertical />
          <Candlestick />
          <XAxis />
          <YAxis />
          <ChartTooltip />
        </CandlestickChart>
      </div>
    </main>
  );
}