About
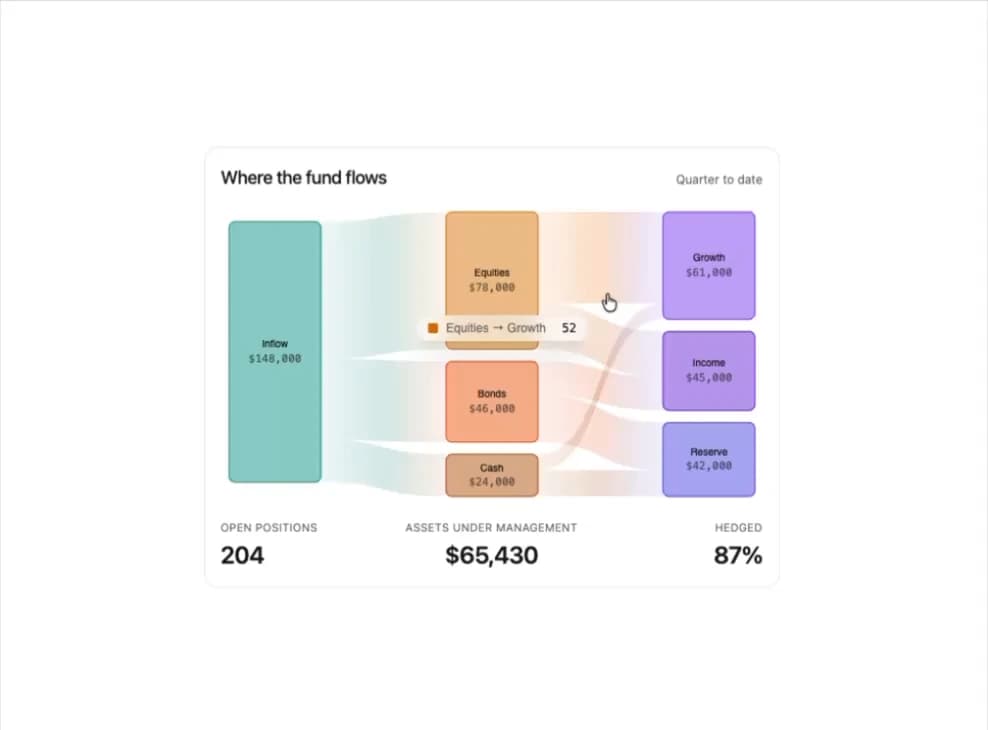
A fund allocation flow chart showing how money moves between inflow, asset classes and outcomes, with labelled nodes and a stat row underneath.
Built with React and Tailwind. Copy the prompt and paste it into Claude Code, Cursor or Lovable: your agent adds Allocation Sankey Chart to your project and fits it to your theme.
Code
How Allocation Sankey Chart is used: the demo's code. The component's own source comes with a free account.
Usage.tsx
import EChartsAllocationSankeyChart from "@/components/ui/allocation-echarts-sankey-chart";

export default function AllocationSankeyChartDemo() {
  return (
    <div className="flex h-screen w-full items-center justify-center bg-background p-6">
      <div className="h-[440px] w-full max-w-xl rounded-xl border bg-card">
        <EChartsAllocationSankeyChart />
      </div>
    </div>
  );
}
More by Legion Dev
View all
CPU Architecture
1.9K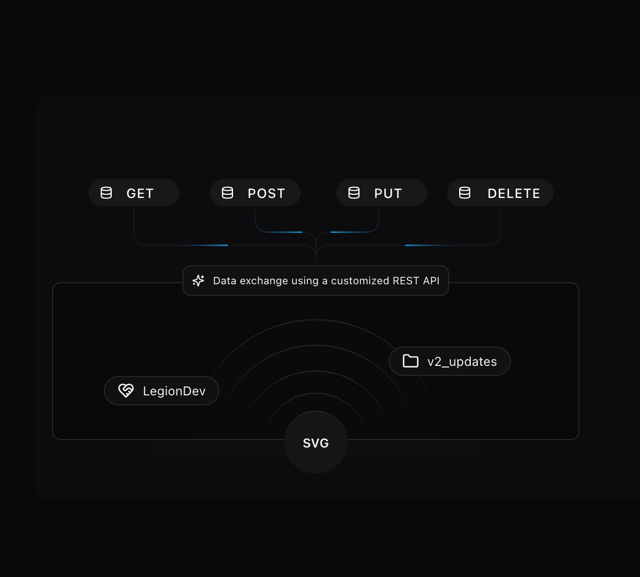
Database With REST API
1.2K
Radar Chart
364
Pie Chart
233
Line Chart
127
Area Chart
116
Bar Chart
102
LegionWebDev
88
More in Dashboards
View all
Dashboard with Collapsible Sidebar
2.5K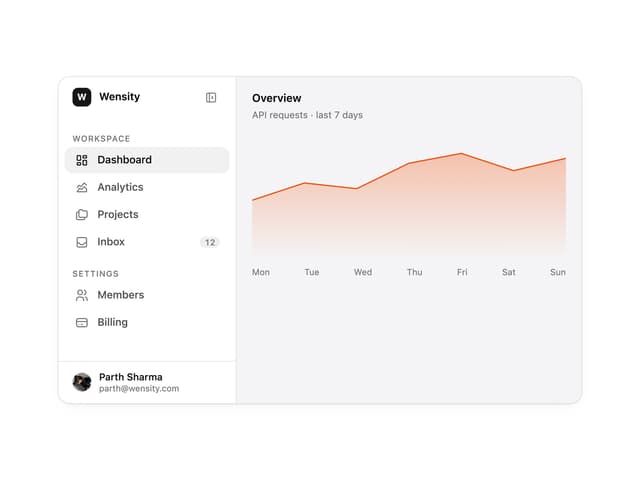

Sidebar
307

SaaS Template
2.5K
Stats Bento
1.1K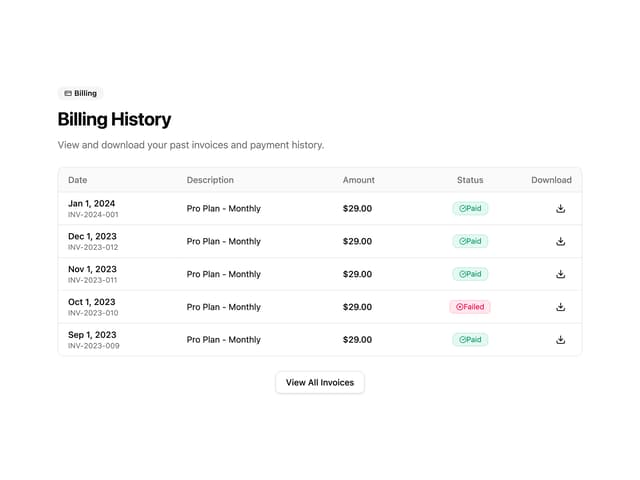

Invoice History Table
80

Data Grid Table
8

System Status Block
321

Course Design Cards
1.1K

