Dashboard Components for React & Next.js
Build robust admin panels and analytics with 30 dashboard components, all crafted for React and styled with Tailwind CSS.
Browse components

Dashboard with Collapsible Sidebar
2.6K
Stat Card
48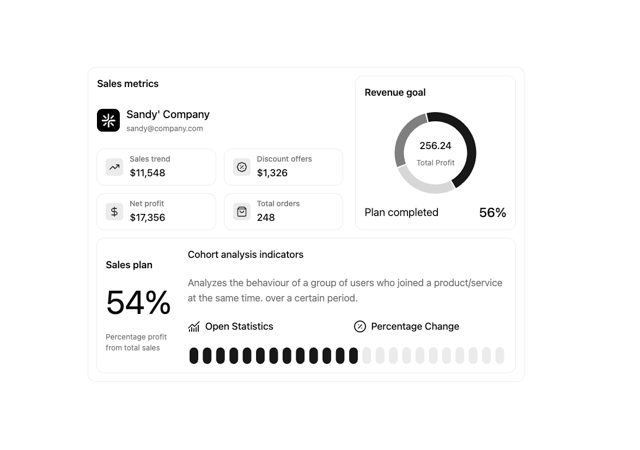

Chart Component
11

Sidebar
395

SaaS Template
2.7K

Fitness Bento Grid
45

Financial Bento Grid
130

Course Design Cards
1.3K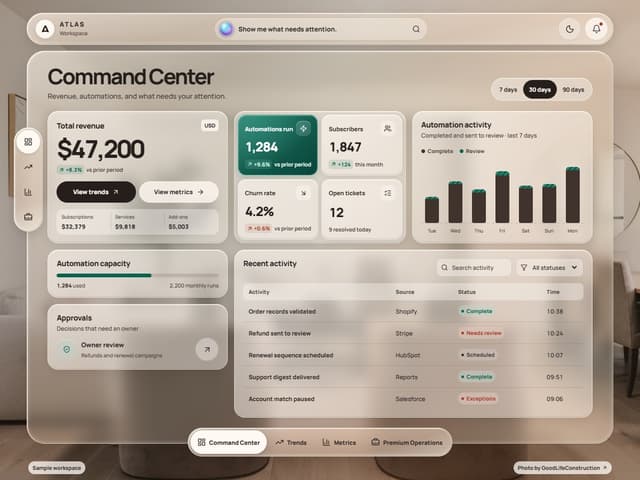

Glassy Dashboard
291
Stats Bento
1.2K

Data Grid Table
7
Statistics Card 7
328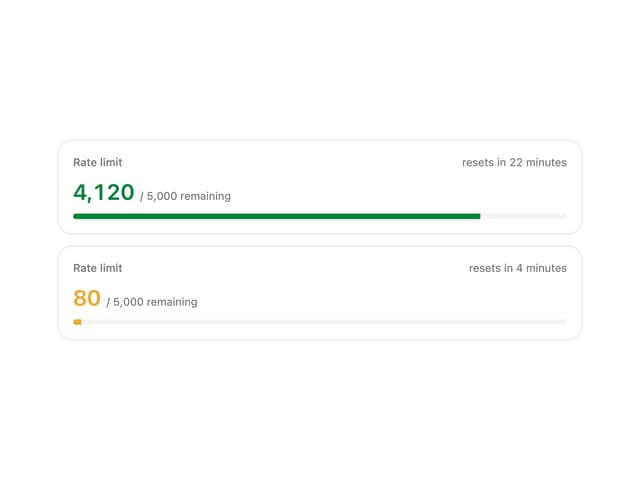
Rate Limit Meter
38
The Item one
7
Statistics Card 2
306

Chat template
668


Keep browsing with a free account
See all 12,000+ components, 413 templates, 1,007 themes and 138 apps, save favourites and copy two prompts a day for free. No card needed
More dashboard components
- Data Grid Table by Sean Hello
- Data Grid Table by Sean Hello
- Bar Chart by Intent UI
- Navbar by AliFarooqDev
- Live Visitors Map by lumesec
- Funnel Chart by bklitai
- Recent Activity Card by 7Ovr - Oliver
- Funnel Chart Big by REAVIZ
- Cell-to-Card Calendar Expansion by Alok
- Animated Sidebar by Saurabh
- Stats cards with links by Ephraim Duncan
- Crypto Dashboard by reuno-ui
- Dashboard Sidebar by Arun Dass
- Dashboard by Ravi Katiyar
- Sidebar by Manu Arora
- Orbit Ring Stats by ham7a311
- System Status Block by Preet Suthar
- Metric Trend Chart by WRAPCODERS
- Dark Theme Icon by Campsite
- Chart Line by mirukullacode
- Progress Metric Card by Mak VieSAinte
- Bar Race Chart by DHxWhy
- Bar Chart by haassiib
- Weather Widget by vijayksingh
- Data Grid Table by Sean Hello
- Funnel Chart by bklitai
- Stats cards with links by Ephraim Duncan
- Navbar by AliFarooqDev
- Table by Origin UI
- Crypto Dashboard by reuno-ui
- Number Ticker by Daniel Petho
- Dot Tiles by Louis Studios
- Data Card by lailai0916
- Animated Bar Chart Dashboard by Kedhareswer Naidu
- Card Tabs by uiable
- Dot Graph Card by Alok
- Nested Dashboard Menu by Ruixen
- Charts & KPI Cards by Mohamed Uvaish
- Animated Features Bento with Live Diagrams by Kedhareswer Naidu
- Dashboard by Ravi Katiyar
- Stats Band by kuratlielia
- Donut Chart With Center Stats by Sean Hello
- Decision Inbox by flohoeller
- Dashboard Activities by Sonu kumar
- Dashboard Stats Skeleton by Cnippet
- Content Block by Méschac Irung
- LED Dot Matrix Chart Card by Kedhareswer Naidu
- Weather Widget by vijayksingh
- Data Grid Table by Sean Hello
- Funnel Chart by bklitai
- Stats cards with links by Ephraim Duncan
- Donut Chart by Ravi Katiyar
- Fullscreen Calendar by Ahmed Mayara
- Financial Dashboard by Ravi Katiyar
- KPI Tile by OSAGI
- Sidebar with Browser like Tabs by Arunachalam
- Settings Sidebar Layout by felipemenezes098
- Line Charts 9 by Sean Hello
- Spark Table by Isaiah
- Dotted Pattern Bar Chart by Sean Hello
- serf dashboard by anark
- Incident Report Large by REAVIZ
- settings by LN
- Area Chart by retroui
- Tooltip by Abraham
- AI Agent Pipeline by Monolyth Dev
- Sidebar by Andrew Luo
- Floating Panel by Abraham
- Agent Roster by vamsiy78
- Task List Card by tailwind-admin
- Total Sales Chart by Ahmed Mayara
- Container Scroll Animation by Manu Arora
- Data Grid Table by Sean Hello
- Funnel Chart by bklitai
- Uptime Pet by Aashir Zayd
- Bar Chart by Legion Dev
- Bar Chart by kevingirelli
- Animated Dashboard Card by Isaiah
- Navbars by Arihant jain
- Progress by Kavi Katiyar
- Webhook Empty State by Arihant jain
- Monospace Bar Chart by Legion Dev
- Card by Wensity Labs
- Account Settings by Clevision
- Usage Dashboard by Mohammad Shehadeh
- Animated Bar Chart by Sean Hello
- Stats cards with links by Ephraim Duncan
- Earnings Donut Chart by ShadcnSpace
- Line Charts 1 by Sean Hello
- Chart Tooltip by uiable
- Card by Mahmoud Ilyan
- Line Chart by Legion Dev
- Chart by mohammed-saif-ibrahim
- Project Management Table by ShadcnSpace
- Swapy Draggable Card by ui layout
- Rail Panel Sidebar – Icon Rail with Context Panels, Pin to Collapse and Hover Peek by DHxWhy
- Data Grid Table by Sean Hello
- Funnel Chart by bklitai
- Bar Chart by Legion Dev
- Area Chart by Legion Dev
- Line Chart by Legion Dev
- Gradient Area Chart with Stripe Overlay by Sean Hello
- Line Charts 6 by Sean Hello
- Folder Card by Ravi Katiyar
- Trend Card by Ravi Katiyar
- ZoomDepthTabs by Ruixen
- Heat Map XL by REAVIZ
- Auth Section 3 by solaceui
- API Key Manager by Kiki
- Radar Chart by Intent UI
- Chart Area by uiable
- Sparkline by appica-dev
- Skills Progress Dashboard by ShadcnSpace
- Visualize Booking by LN
- Audit Log Table by Arihant jain
- Area Chart by REAVIZ
- Stats Card by Kavi Katiyar
- Leads Data Table by Isaiah
- Draggable Grid Dashboard by ui layout
- Monthly Visitors Line Chart by 7Ovr - Oliver
- Data Grid Table by Sean Hello
- Funnel Chart by bklitai
- Bar Chart by Legion Dev
- Allocation Sankey Chart by Legion Dev
- Lighthouse Scores Radial Chart by Sean Hello
- Pie Chart by Legion Dev
- Radar Score Chart by Sean Hello
- Metrics Board by aadilghani1
- Card by Ravi Katiyar
- Area Chart Analytics Card by Ahmed Mayara
- Dashboard Overview by Sonu kumar
- User Table by alain00
- Sidebar Light by inference-sh
- Conversion Stats Card by LaviKatiyar
- Sidebar with Search and Profile by uiable
- Server Card by Mohammad Shehadeh
- Bento Product Features by Kavi Katiyar
- Complete Crypto Wallet Integration by SO called
- Sales Overview Bar Chart by ShadcnSpace
- Traffic Source Donut by 7Ovr - Oliver
- Grouped Bar Chart by Isaiah
- Builder OS Bento by Drew Sepeczi
- Animated Bar Chart by mirukullacode
- Hero Section by Mikolaj Dobrucki
- Data Grid Table by Sean Hello
- Bar Chart by Legion Dev
- Bug Priority Pie Chart by Sean Hello
- Crosshatch Area Chart by Sean Hello
- Featured Image Section by Ruixen
- Table by micka_design
- Conversion Funnel Area Chart by Ahmed Mayara
- Quota Candle by Aashir Zayd
About dashboard components
This collection gathers 83 dashboard components for building admin panels and analytics views. You get stat tiles, chart cards, data tables, sidebars, activity feeds, and full page shells that tie them together. Styles cover clean SaaS admin looks, dense data-heavy layouts, and developer-oriented consoles. Whether you are assembling a category management view or a software development dashboard, these give you the building blocks and full layout examples to start from.
Compose a shell from a sidebar and a top bar, then drop stat cards and charts into the main grid. Each component is React with Tailwind CSS and slots into a Next.js app route without extra wiring. Copy the TSX, install via the shadcn CLI using the registry URL, or pull one through the Magic MCP from Cursor or Claude Code. Preview the layout live, then connect your own data source.