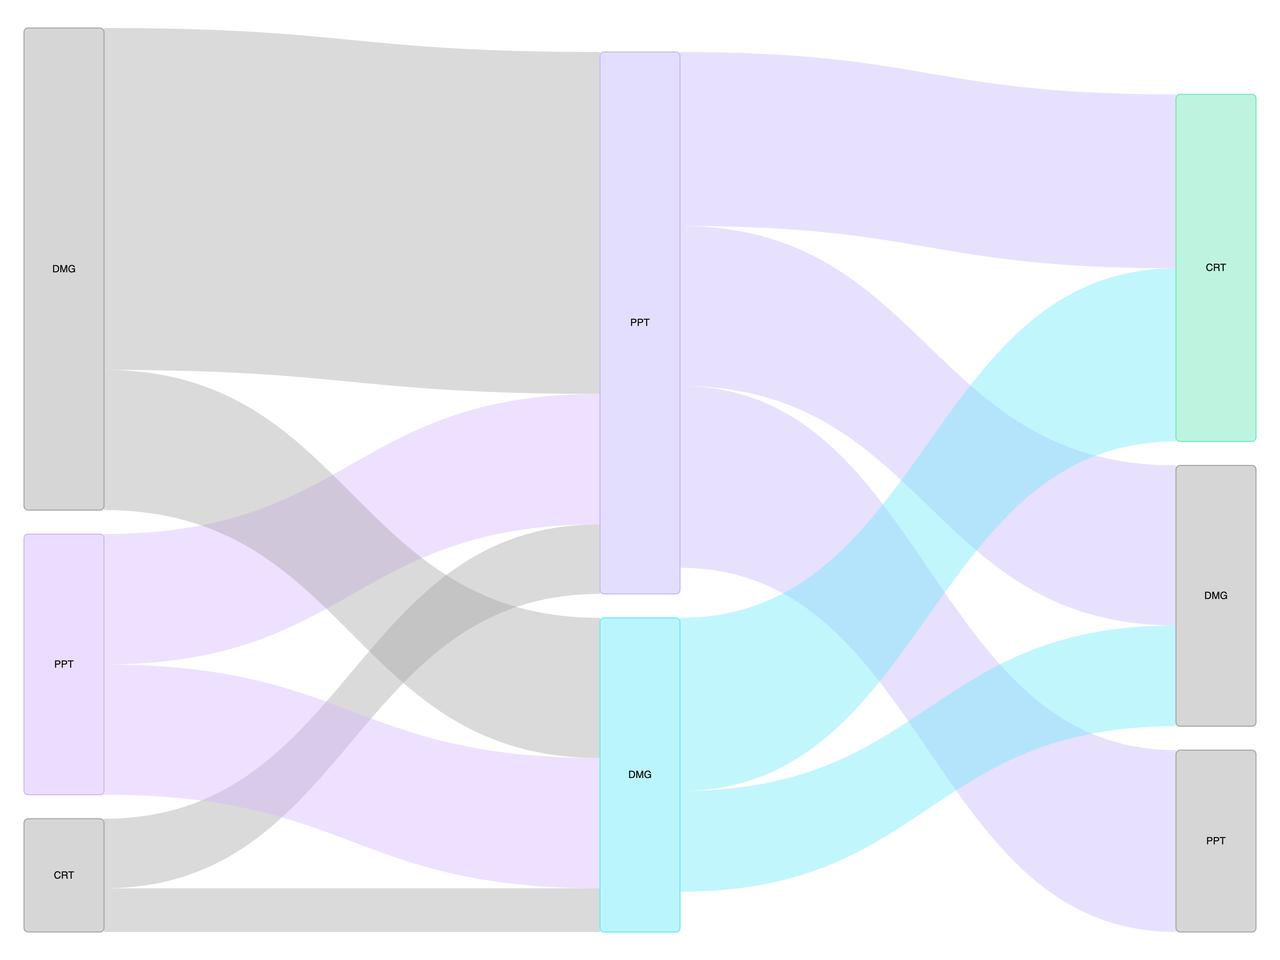
"use client";

import {
  EChartsSankeyChart,
  type SankeyData,
  type ChartConfig,
} from "@/components/ui/echarts-sankey-chart";

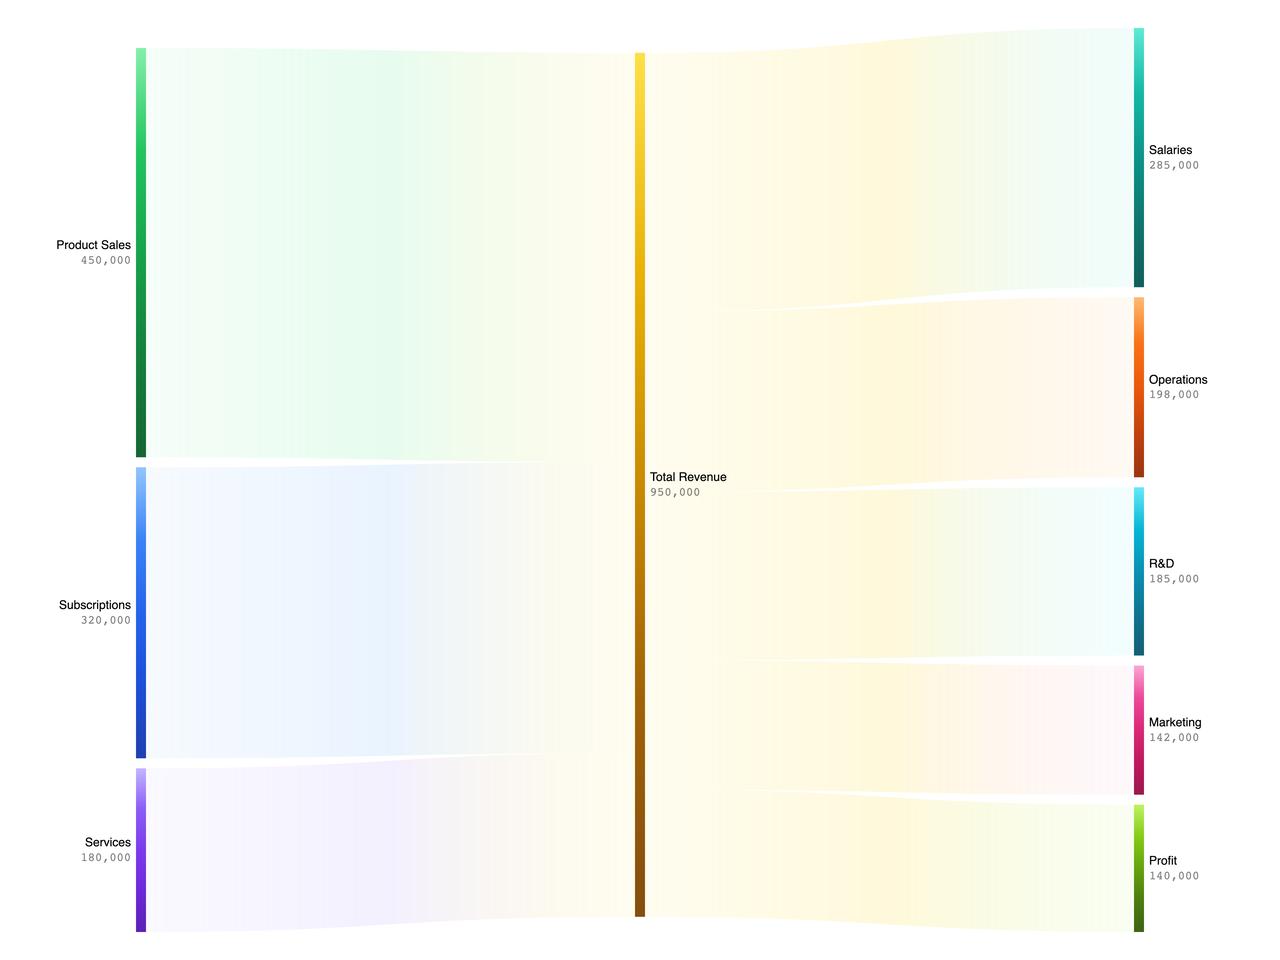
// Budget allocation - revenue to expenses
const data: SankeyData = {
  nodes: [
    { name: "ProductSales" },
    { name: "Subscriptions" },
    { name: "Services" },
    { name: "TotalRevenue" },
    { name: "Research" },
    { name: "Marketing" },
    { name: "Operations" },
    { name: "Salaries" },
    { name: "Profit" },
  ],
  links: [
    { source: 0, target: 3, value: 450000 },
    { source: 1, target: 3, value: 320000 },
    { source: 2, target: 3, value: 180000 },
    { source: 3, target: 4, value: 185000 },
    { source: 3, target: 5, value: 142000 },
    { source: 3, target: 6, value: 198000 },
    { source: 3, target: 7, value: 285000 },
    { source: 3, target: 8, value: 140000 },
  ],
};

const chartConfig = {
  ProductSales: {
    label: "Product Sales",
    colors: {
      light: ["#86efac", "#22c55e", "#16a34a", "#15803d", "#166534"],
      dark: ["#bbf7d0", "#4ade80", "#22c55e", "#16a34a", "#15803d"],
    },
  },
  Subscriptions: {
    label: "Subscriptions",
    colors: {
      light: ["#93c5fd", "#3b82f6", "#2563eb", "#1d4ed8", "#1e40af"],
      dark: ["#bfdbfe", "#60a5fa", "#3b82f6", "#2563eb", "#1d4ed8"],
    },
  },
  Services: {
    label: "Services",
    colors: {
      light: ["#c4b5fd", "#8b5cf6", "#7c3aed", "#6d28d9", "#5b21b6"],
      dark: ["#ddd6fe", "#a78bfa", "#8b5cf6", "#7c3aed", "#6d28d9"],
    },
  },
  TotalRevenue: {
    label: "Total Revenue",
    colors: {
      light: ["#fde047", "#eab308", "#ca8a04", "#a16207", "#854d0e"],
      dark: ["#fef08a", "#facc15", "#eab308", "#ca8a04", "#a16207"],
    },
  },
  Research: {
    label: "R&D",
    colors: {
      light: ["#67e8f9", "#06b6d4", "#0891b2", "#0e7490", "#155e75"],
      dark: ["#a5f3fc", "#22d3ee", "#06b6d4", "#0891b2", "#0e7490"],
    },
  },
  Marketing: {
    label: "Marketing",
    colors: {
      light: ["#f9a8d4", "#ec4899", "#db2777", "#be185d", "#9d174d"],
      dark: ["#fbcfe8", "#f472b6", "#ec4899", "#db2777", "#be185d"],
    },
  },
  Operations: {
    label: "Operations",
    colors: {
      light: ["#fdba74", "#f97316", "#ea580c", "#c2410c", "#9a3412"],
      dark: ["#fed7aa", "#fb923c", "#f97316", "#ea580c", "#c2410c"],
    },
  },
  Salaries: {
    label: "Salaries",
    colors: {
      light: ["#5eead4", "#14b8a6", "#0d9488", "#0f766e", "#115e59"],
      dark: ["#99f6e4", "#2dd4bf", "#14b8a6", "#0d9488", "#0f766e"],
    },
  },
  Profit: {
    label: "Profit",
    colors: {
      light: ["#bef264", "#84cc16", "#65a30d", "#4d7c0f", "#3f6212"],
      dark: ["#d9f99d", "#a3e635", "#84cc16", "#65a30d", "#4d7c0f"],
    },
  },
} satisfies ChartConfig;

export default function EChartsExampleSankeyChart() {
  return (
    <div className="w-full h-screen">
      <EChartsSankeyChart
        className="h-full w-full p-4"
        data={data}
        config={chartConfig}
      >
        <EChartsSankeyChart.Node isClickable>
          <EChartsSankeyChart.NodeLabel position="outside" showValues />
        </EChartsSankeyChart.Node>
        <EChartsSankeyChart.Link variant="gradient" />
        <EChartsSankeyChart.Tooltip />
      </EChartsSankeyChart>
    </div>
  );
}