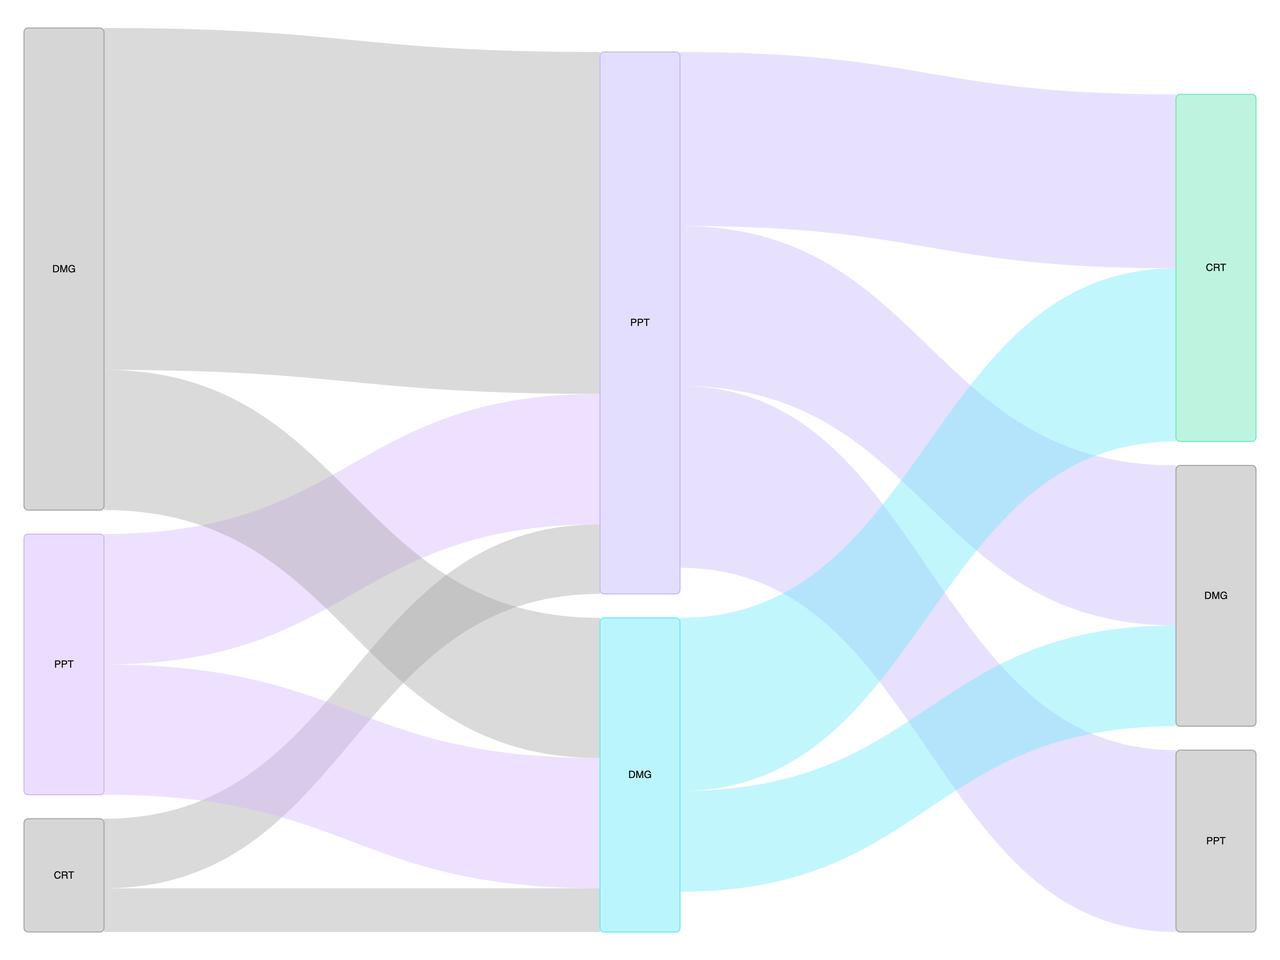
"use client";

import {
  EChartsSankeyChart,
  type SankeyData,
  type ChartConfig,
} from "@/components/ui/echarts-sankey-chart";

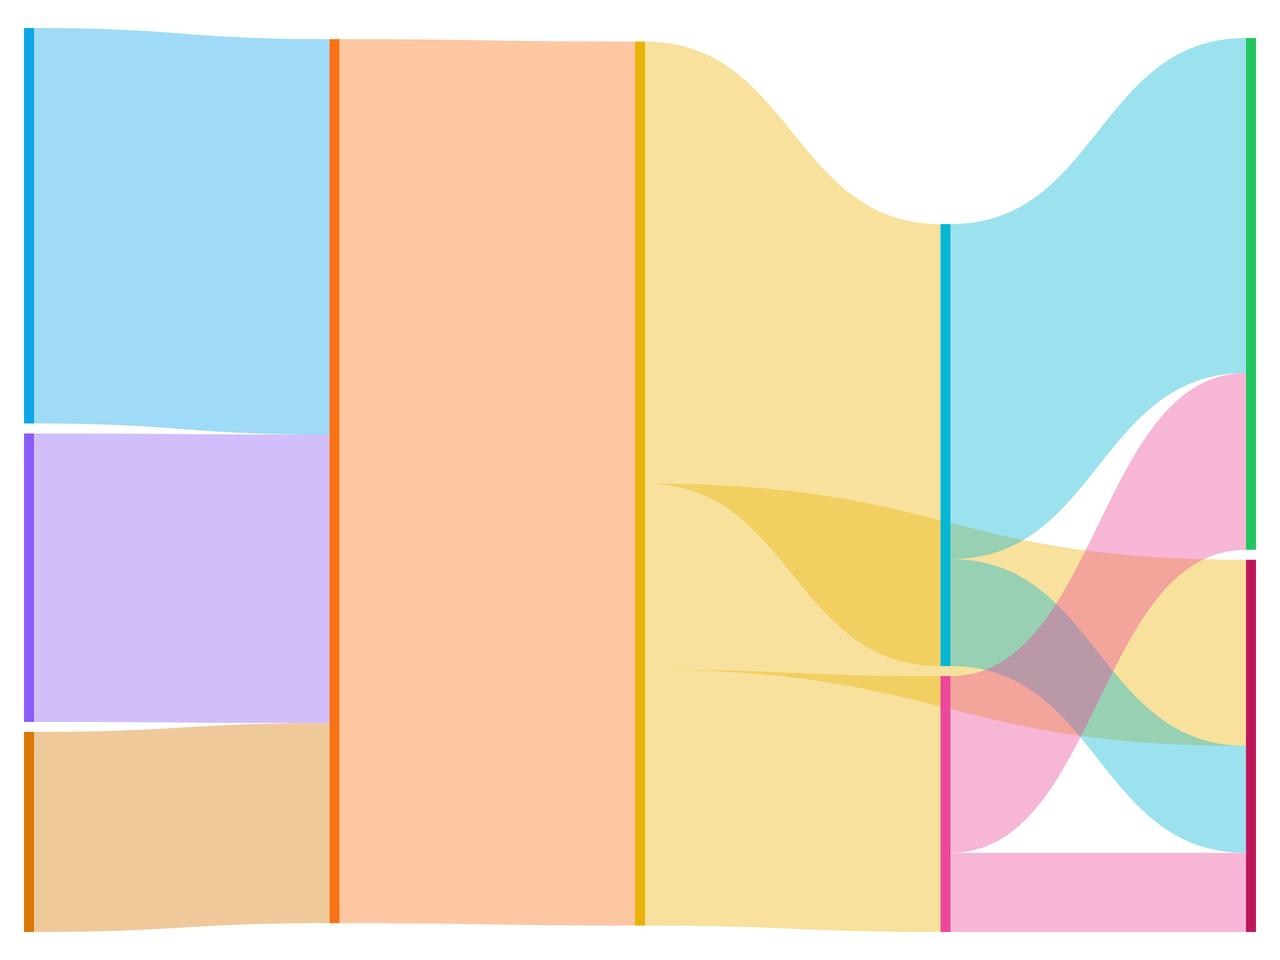
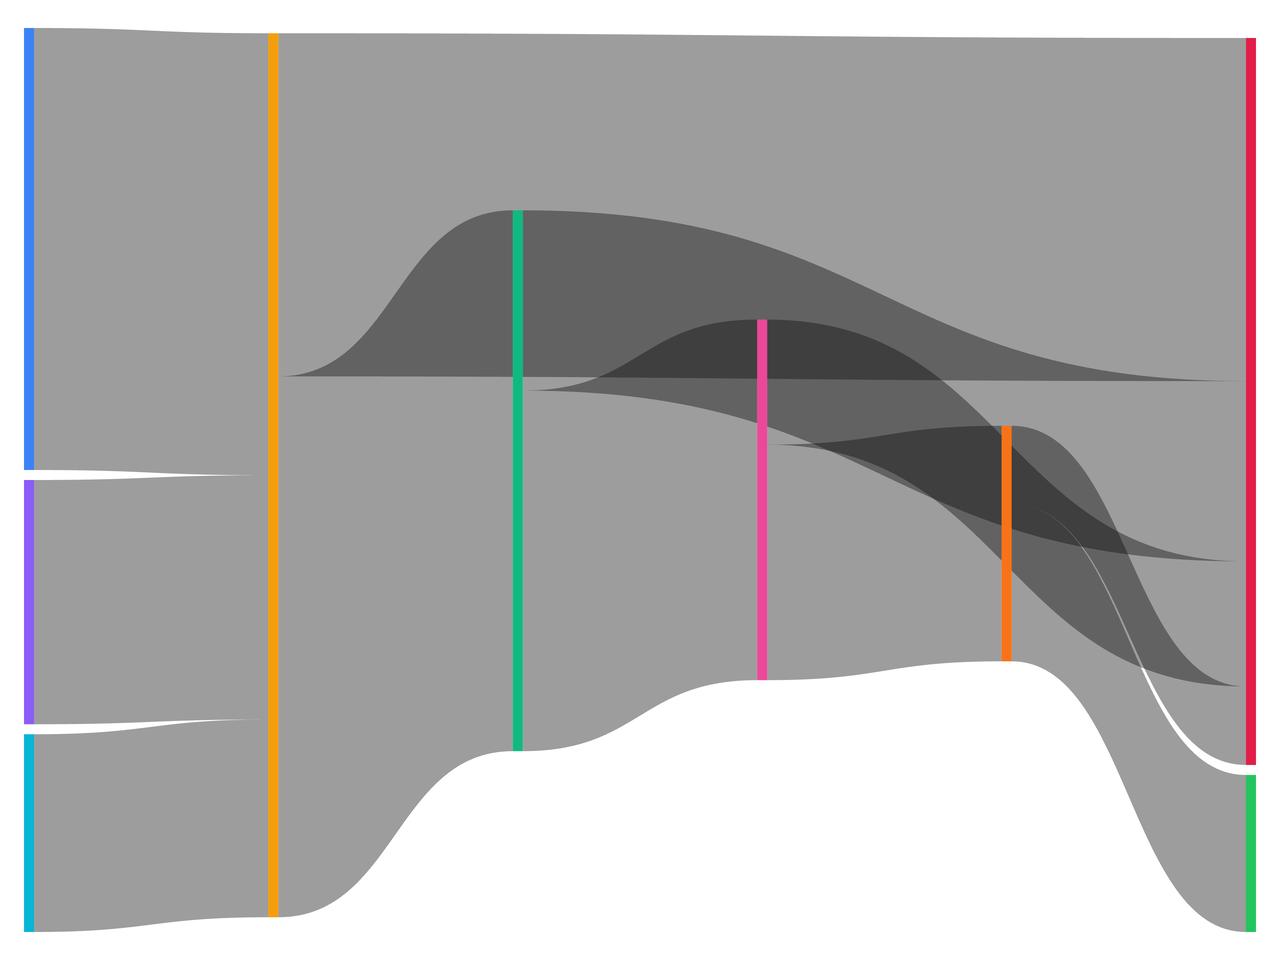
// Data pipeline - sources through processing to destinations
const data: SankeyData = {
  nodes: [
    { name: "API" },
    { name: "Database" },
    { name: "Logs" },
    { name: "Ingestion" },
    { name: "Transform" },
    { name: "Analytics" },
    { name: "MLPipeline" },
    { name: "Dashboard" },
    { name: "Archive" },
  ],
  links: [
    { source: 0, target: 3, value: 85000 },
    { source: 1, target: 3, value: 62000 },
    { source: 2, target: 3, value: 43000 },
    { source: 3, target: 4, value: 190000 },
    { source: 4, target: 5, value: 95000 },
    { source: 4, target: 6, value: 55000 },
    { source: 4, target: 8, value: 40000 },
    { source: 5, target: 7, value: 72000 },
    { source: 5, target: 8, value: 23000 },
    { source: 6, target: 7, value: 38000 },
    { source: 6, target: 8, value: 17000 },
  ],
};

const chartConfig = {
  API: {
    label: "API Events",
    colors: {
      light: ["#0ea5e9"],
      dark: ["#38bdf8"],
    },
  },
  Database: {
    label: "Database",
    colors: {
      light: ["#8b5cf6"],
      dark: ["#a78bfa"],
    },
  },
  Logs: {
    label: "Log Files",
    colors: {
      light: ["#d97706"],
      dark: ["#fbbf24"],
    },
  },
  Ingestion: {
    label: "Ingestion Layer",
    colors: {
      light: ["#f97316"],
      dark: ["#fb923c"],
    },
  },
  Transform: {
    label: "Transform",
    colors: {
      light: ["#eab308"],
      dark: ["#facc15"],
    },
  },
  Analytics: {
    label: "Analytics",
    colors: {
      light: ["#06b6d4"],
      dark: ["#22d3ee"],
    },
  },
  MLPipeline: {
    label: "ML Pipeline",
    colors: {
      light: ["#ec4899"],
      dark: ["#f472b6"],
    },
  },
  Dashboard: {
    label: "Dashboard",
    colors: {
      light: ["#22c55e"],
      dark: ["#4ade80"],
    },
  },
  Archive: {
    label: "Archive",
    colors: {
      light: ["#be185d"],
      dark: ["#ec4899"],
    },
  },
} satisfies ChartConfig;

export default function EChartsExampleSankeyChart() {
  return (
    <div className="w-full h-screen">
      <EChartsSankeyChart
        className="h-full w-full p-4"
        data={data}
        config={chartConfig}
      >
        <EChartsSankeyChart.Node isClickable />
        <EChartsSankeyChart.Link variant="source" />
        <EChartsSankeyChart.Tooltip />
      </EChartsSankeyChart>
    </div>
  );
}