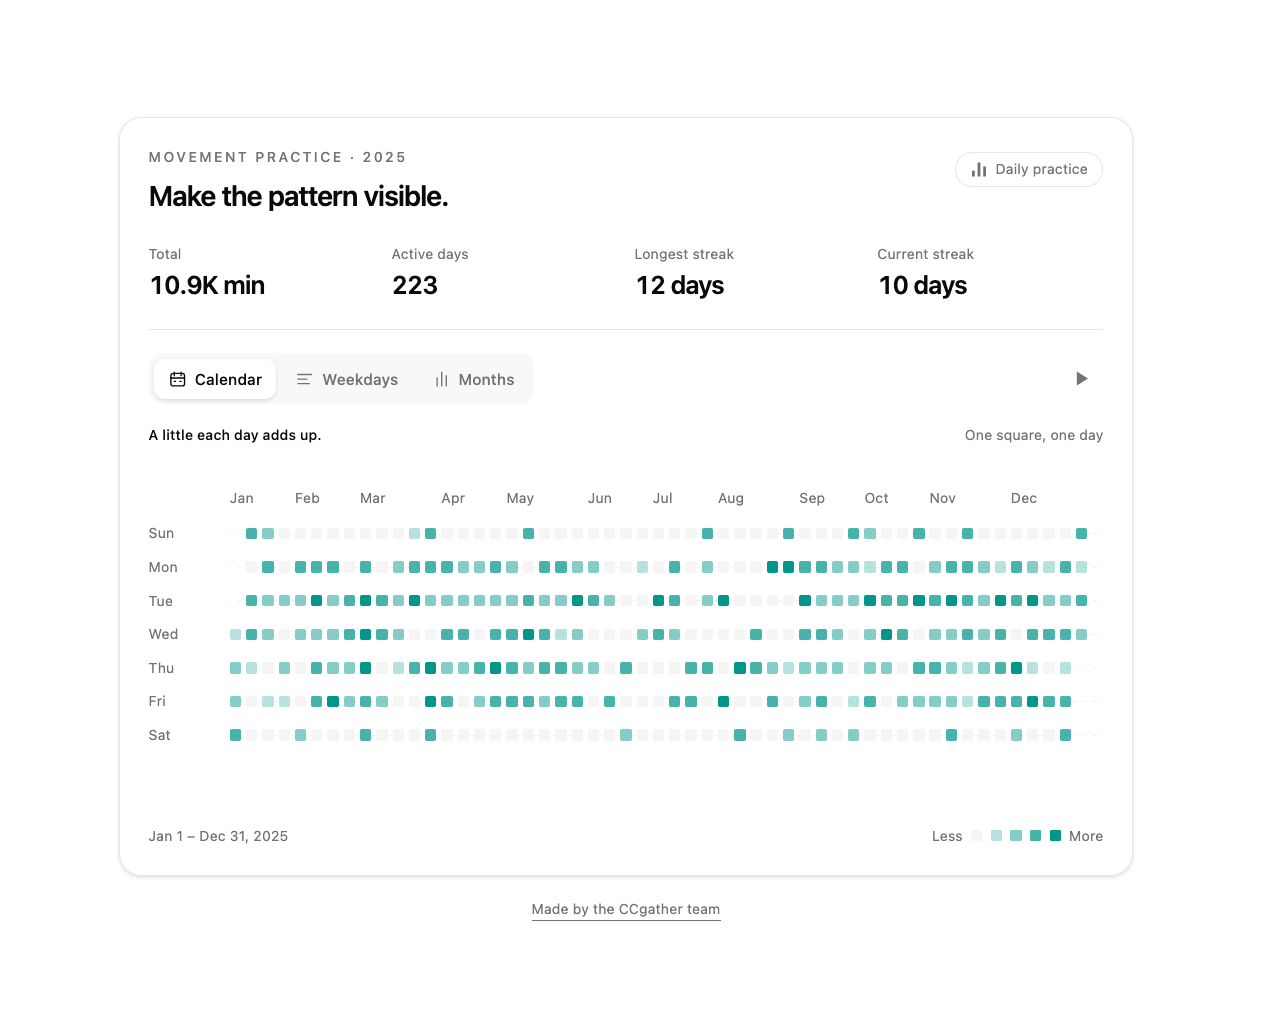
Activity heatmap calendar for React and Tailwind CSS (shadcn/ui) where every day is a square that flies into weekday and month bar charts. It is built to turn a year of check-ins into answers people can see: the same squares rearrange from the calendar into weekday rows and monthly columns, so the busiest day, the strongest month and the quiet season stand out without reading numbers. Shows total, active days, longest and current streaks, highlights the leading weekday or month, and fits the whole year to any width without horizontal scrolling. Tooltips, keyboard navigation for views and days, controlled or uncontrolled view, optional auto-cycling for showcases, theme tokens for light and dark, reduced-motion support and SSR-safe dates. Use it for habit and fitness trackers, learning streaks, contribution graphs, and support or sales dashboards.