
About
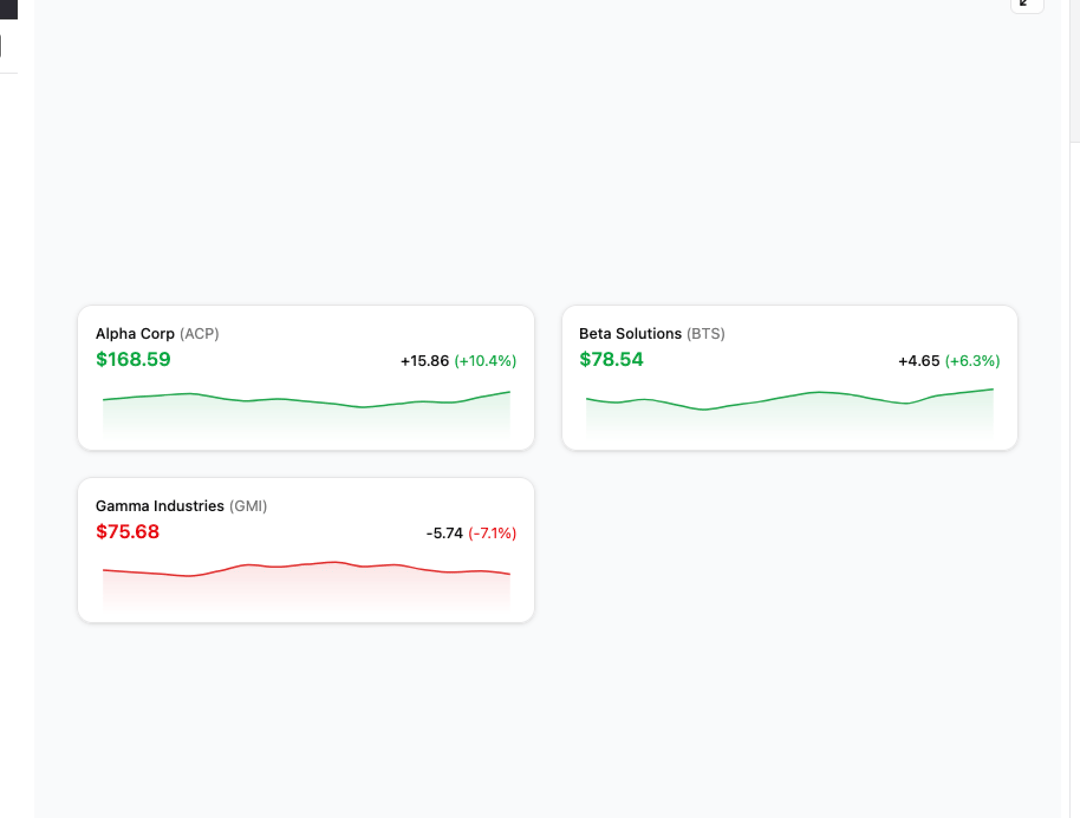
Here is Stats cards with links
Built with React and Tailwind. Copy the prompt and paste it into Claude Code, Cursor or Lovable: your agent adds Stats cards with links to your project and fits it to your theme.
Code
How Stats cards with links is used: the demo's code. The component's own source comes with a free account.
Usage.tsx
"use client";

import * as React from "react";
import { clsx, type ClassValue } from "clsx";
import { twMerge } from "tailwind-merge";
import * as RechartsPrimitive from "recharts";
import { ExternalLink } from "lucide-react";

function cn(...inputs: ClassValue[]) {
  return twMerge(clsx(inputs));
}

const Card = React.forwardRef<
  HTMLDivElement,
  React.HTMLAttributes<HTMLDivElement>
>(({ className, ...props }, ref) => (
  <div
    ref={ref}
    className={cn(
      "rounded-xl border bg-card text-card-foreground shadow",
      className
    )}
    {...props}
  />
));
Card.displayName = "Card";

const CardContent = React.forwardRef<
  HTMLDivElement,
  React.HTMLAttributes<HTMLDivElement>
>(({ className, ...props }, ref) => (
  <div ref={ref} className={cn("p-6 pt-0", className)} {...props} />
));
CardContent.displayName = "CardContent";

// Chart related components and types
const THEMES = { light: "", dark: ".dark" } as const;

export type ChartConfig = {
  [k in string]: {
    label?: React.ReactNode;
    icon?: React.ComponentType;
  } & (
    | { color?: string; theme?: never }
    | { color?: never; theme: Record<keyof typeof THEMES, string> }
  );
};

type ChartContextProps = {
  config: ChartConfig;
};

const ChartContext = React.createContext<ChartContextProps | null>(null);

function useChart() {
  const context = React.useContext(ChartContext);

  if (!context) {
    throw new Error("useChart must be used within a <ChartContainer />");
  }

  return context;
}

const ChartStyle = ({ id, config }: { id: string; config: ChartConfig }) => {
  const colorConfig = Object.entries(config).filter(
    ([, config]) => config.theme || config.color
  );

  if (!colorConfig.length) {
    return null;
  }

  return (
    <style
      dangerouslySetInnerHTML={{
        __html: Object.entries(THEMES)
          .map(
            ([theme, prefix]) => `
${prefix} [data-chart=${id}] {
${colorConfig
  .map(([key, itemConfig]) => {
    const color =
      itemConfig.theme?.[theme as keyof typeof itemConfig.theme] ||
      itemConfig.color;
    return color ? `  --color-${key}: ${color};` : null;
  })
  .join("\n")}
}
`
          )
          .join("\n"),
      }}
    />
  );
};

function ChartContainer({
  id,
  className,
  children,
  config,
  ...props
}: React.ComponentProps<"div"> & {
  config: ChartConfig;
  children: React.ComponentProps<
    typeof RechartsPrimitive.ResponsiveContainer
  >["children"];
}) {
  const uniqueId = React.useId();
  const chartId = `chart-${id || uniqueId.replace(/:/g, "")}`;

  return (
    <ChartContext.Provider value={{ config }}>
      <div
        data-slot="chart"
        data-chart={chartId}
        className={cn(
          "[&_.recharts-cartesian-axis-tick_text]:fill-muted-foreground [&_.recharts-cartesian-grid_line[stroke='#ccc']]:stroke-border/50 [&_.recharts-curve.recharts-tooltip-cursor]:stroke-border [&_.recharts-polar-grid_[stroke='#ccc']]:stroke-border [&_.recharts-radial-bar-background-sector]:fill-muted [&_.recharts-rectangle.recharts-tooltip-cursor]:fill-muted [&_.recharts-reference-line_[stroke='#ccc']]:stroke-border flex aspect-video justify-center text-xs [&_.recharts-dot[stroke='#fff']]:stroke-transparent [&_.recharts-layer]:outline-hidden [&_.recharts-sector]:outline-hidden [&_.recharts-sector[stroke='#fff']]:stroke-transparent [&_.recharts-surface]:outline-hidden",
          className
        )}
        {...props}
      >
        <ChartStyle id={chartId} config={config} />
        <RechartsPrimitive.ResponsiveContainer>
          {children}
        </RechartsPrimitive.ResponsiveContainer>
      </div>
    </ChartContext.Provider>
  );
}

const data = [
  {
    date: "Nov 24, 2023",
    "Alpha Corp": 142.87,
    "Beta Solutions": 65.32,
    "Gamma Industries": 83.25,
  },
  {
    date: "Nov 25, 2023",
    "Alpha Corp": 151.43,
    "Beta Solutions": 59.78,
    "Gamma Industries": 79.64,
  },
  {
    date: "Nov 26, 2023",
    "Alpha Corp": 157.28,
    "Beta Solutions": 64.21,
    "Gamma Industries": 76.19,
  },
  {
    date: "Nov 27, 2023",
    "Alpha Corp": 162.94,
    "Beta Solutions": 57.46,
    "Gamma Industries": 72.84,
  },
  {
    date: "Nov 28, 2023",
    "Alpha Corp": 148.37,
    "Beta Solutions": 49.82,
    "Gamma Industries": 81.56,
  },
  {
    date: "Nov 29, 2023",
    "Alpha Corp": 139.56,
    "Beta Solutions": 55.63,
    "Gamma Industries": 92.38,
  },
  {
    date: "Nov 30, 2023",
    "Alpha Corp": 145.83,
    "Beta Solutions": 61.27,
    "Gamma Industries": 88.75,
  },
  {
    date: "Dec 01, 2023",
    "Alpha Corp": 138.29,
    "Beta Solutions": 68.94,
    "Gamma Industries": 93.42,
  },
  {
    date: "Dec 02, 2023",
    "Alpha Corp": 129.64,
    "Beta Solutions": 74.56,
    "Gamma Industries": 97.18,
  },
  {
    date: "Dec 03, 2023",
    "Alpha Corp": 119.82,
    "Beta Solutions": 71.38,
    "Gamma Industries": 89.43,
  },
  {
    date: "Dec 04, 2023",
    "Alpha Corp": 128.54,
    "Beta Solutions": 63.95,
    "Gamma Industries": 92.76,
  },
  {
    date: "Dec 05, 2023",
    "Alpha Corp": 137.21,
    "Beta Solutions": 58.47,
    "Gamma Industries": 84.29,
  },
  {
    date: "Dec 06, 2023",
    "Alpha Corp": 134.68,
    "Beta Solutions": 69.12,
    "Gamma Industries": 79.38,
  },
  {
    date: "Dec 07, 2023",
    "Alpha Corp": 152.73,
    "Beta Solutions": 73.89,
    "Gamma Industries": 81.42,
  },
  {
    date: "Dec 08, 2023",
    "Alpha Corp": 168.59,
    "Beta Solutions": 78.54,
    "Gamma Industries": 75.68,
  },
];

const summary = [
  {
    name: "Alpha Corp",
    tickerSymbol: "ACP",
    value: "$168.59",
    change: "+15.86",
    percentageChange: "+10.4%",
    changeType: "positive",
  },
  {
    name: "Beta Solutions",
    tickerSymbol: "BTS",
    value: "$78.54",
    change: "+4.65",
    percentageChange: "+6.3%",
    changeType: "positive",
  },
  {
    name: "Gamma Industries",
    tickerSymbol: "GMI",
    value: "$75.68",
    change: "-5.74",
    percentageChange: "-7.1%",
    changeType: "negative",
  },
];

const sanitizeName = (name: string) => {
  return name
    .replace(/\\s+/g, "-")
    .replace(/[^a-zA-Z0-9-]/g, "_")
    .toLowerCase();
};

export default function Stats10() {
  return (
    <div className="flex items-center justify-center p-10 w-full">
      <dl className="grid grid-cols-1 gap-6 sm:grid-cols-2 lg:grid-cols-3 w-full">
        {summary.map((item) => {
          const sanitizedName = sanitizeName(item.name);
          const gradientId = `gradient-${sanitizedName}`;

          const color =
            item.changeType === "positive"
              ? "hsl(142.1 76.2% 36.3%)"
              : "hsl(0 72.2% 50.6%)";

          return (
            <Card key={item.name} className="p-0">
              <CardContent className="p-4 pb-0">
                <div>
                  <dt className="text-sm font-medium text-foreground">
                    {item.name}{" "}
                    <span className="font-normal text-muted-foreground">
                      ({item.tickerSymbol})
                    </span>
                  </dt>
                  <div className="flex items-baseline justify-between">
                    <dd
                      className={cn(
                        item.changeType === "positive"
                          ? "text-green-600 dark:text-green-500"
                          : "text-red-600 dark:text-red-500",
                        "text-lg font-semibold"
                      )}
                    >
                      {item.value}
                    </dd>
                    <dd className="flex items-center space-x-1 text-sm">
                      <span className="font-medium text-foreground">
                        {item.change}
                      </span>
                      <span
                        className={cn(
                          item.changeType === "positive"
                            ? "text-green-600 dark:text-green-500"
                            : "text-red-600 dark:text-red-500"
                        )}
                      >
                        ({item.percentageChange})
                      </span>
                    </dd>
                  </div>
                </div>

                <div className="mt-2 h-16 overflow-hidden">
                  <ChartContainer
                    className="w-full h-full"
                    config={{
                      [item.name]: {
                        label: item.name,
                        color: color,
                      },
                    }}
                  >
                    <RechartsPrimitive.AreaChart data={data}>
                      <defs>
                        <linearGradient
                          id={gradientId}
                          x1="0"
                          y1="0"
                          x2="0"
                          y2="1"
                        >
                          <stop
                            offset="5%"
                            stopColor={color}
                            stopOpacity={0.3}
                          />
                          <stop
                            offset="95%"
                            stopColor={color}
                            stopOpacity={0}
                          />
                        </linearGradient>
                      </defs>
                      <RechartsPrimitive.XAxis dataKey="date" hide={true} />
                      <RechartsPrimitive.Area
                        dataKey={item.name}
                        stroke={color}
                        fill={`url(#${gradientId})`}
                        fillOpacity={0.4}
                        strokeWidth={1.5}
                        type="monotone"
                      />
                    </RechartsPrimitive.AreaChart>
                  </ChartContainer>
                </div>
              </CardContent>
            </Card>
          );
        })}
      </dl>
    </div>
  );
}
Dependencies
More by Ephraim Duncan
View all
Stats
159
Form Layout
101
File Upload
95
login
85
Share Dialog
54
Login & Signup
51
Form
51
Onboarding Activity Feed
43
More in Cards
View all

Course Design Cards
1.3K

Statistics Card 2
303

Interactive Tech Stack Bento Grid with Hover Effects
596
Statistics Card 7
326

Card Studio
14
The Item one
3
Card
72

Card
8