import { DeltaBars, type DeltaSeries } from '@/components/ui/delta-bars'

/**
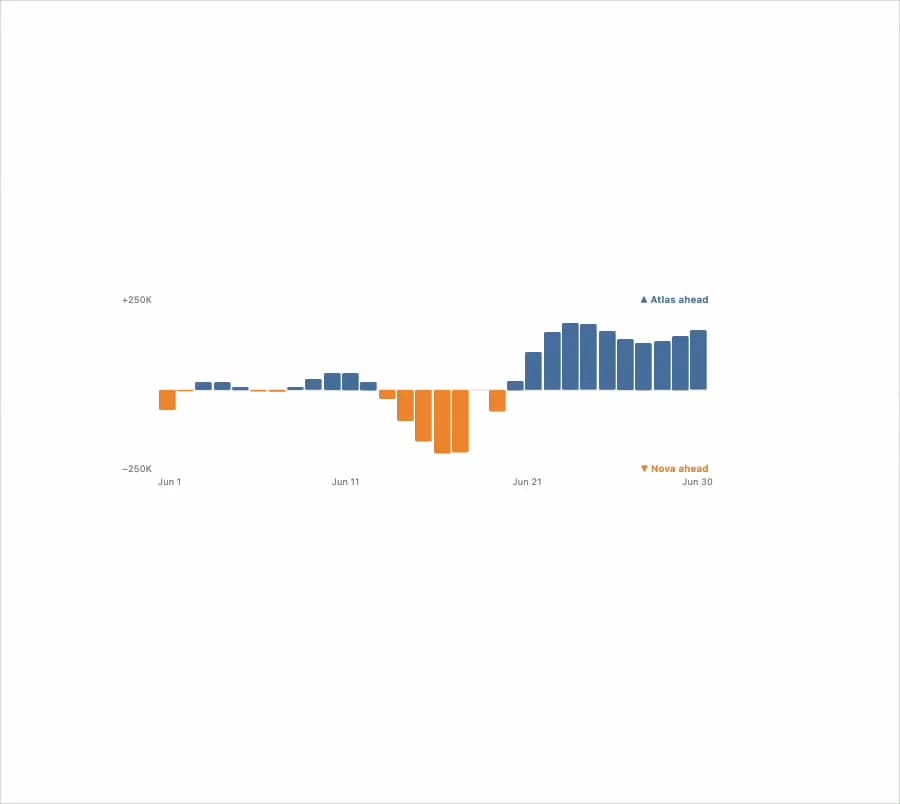
 * Demo: daily request volume for two rival models over 30 days.
 * Deterministic synthetic waves: Atlas trends up and takes the lead
 * mid-month; one reporting gap (null on both) shows the missing-day hole.
 */

const N = 30

function wave(i: number, base: number, trend: number, amp: number, phase: number): number {
  return Math.round(
    base + i * trend + amp * Math.sin(i / 3.1 + phase) + amp * 0.5 * Math.sin(i / 1.6 + phase * 2)
  )
}

const ATLAS: DeltaSeries = {
  label: 'Atlas',
  values: Array.from({ length: N }, (_, i) => (i === 17 ? null : wave(i, 480_000, 9_500, 90_000, 0.4))),
}

const NOVA: DeltaSeries = {
  label: 'Nova',
  values: Array.from({ length: N }, (_, i) => (i === 17 ? null : wave(i, 590_000, 1_500, 80_000, 2.3))),
}

const X_LABELS = [
  { frac: 0.02, text: 'Jun 1' },
  { frac: 0.34, text: 'Jun 11' },
  { frac: 0.67, text: 'Jun 21' },
  { frac: 0.98, text: 'Jun 30' },
]

export default function DeltaBarsDemo() {
  return (
    <div className="mx-auto max-w-4xl p-6">
      <DeltaBars a={ATLAS} b={NOVA} xLabels={X_LABELS} />
    </div>
  )
}