About
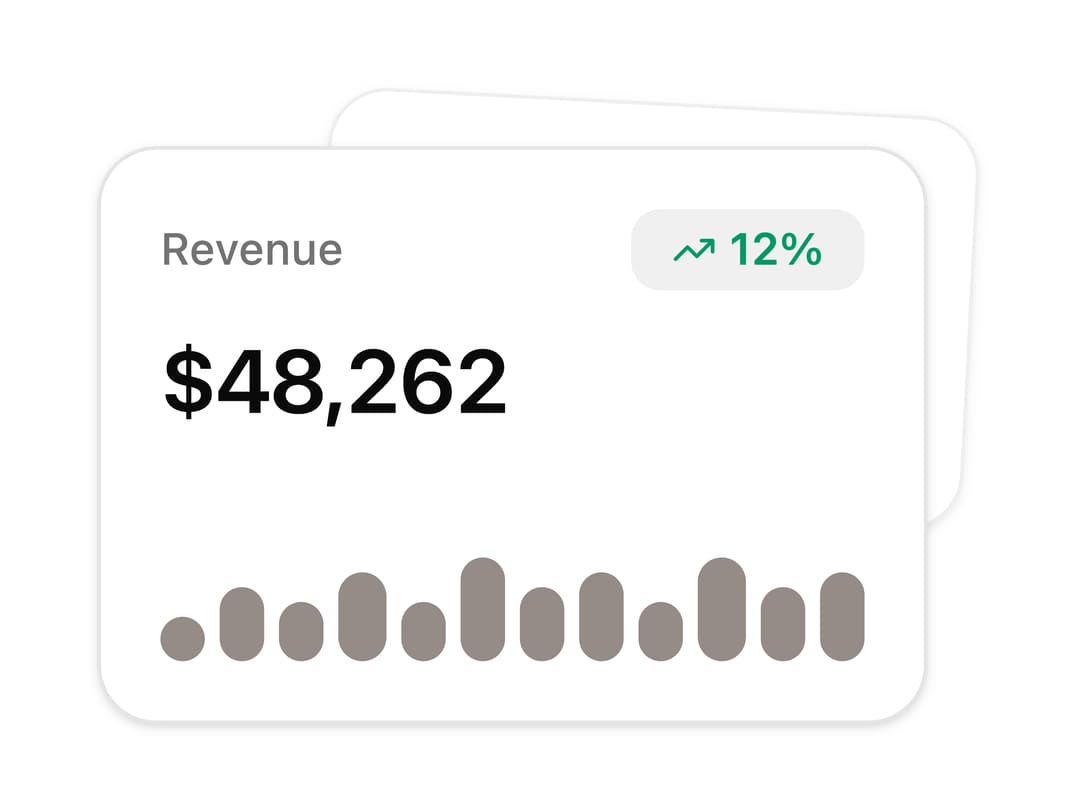
A layered stat card illustration showing a revenue figure, trend badge, and sparkline bar chart over a tilted background card.
Built with React and Tailwind. Copy the prompt and paste it into Claude Code, Cursor or Lovable: your agent adds Revenue Spot Illustration to your project and fits it to your theme.
Code
How Revenue Spot Illustration is used: the demo's code. The component's own source comes with a free account.
Usage.tsx
import Spot01 from "@/components/ui/spot-01";

export default function Spot01Demo() {
  return (
    <div className="flex w-full items-center justify-center p-10">
      <Spot01 />
    </div>
  );
}
Dependencies
More by felipemenezes098
View all
Centered Hero with Image Fan
1K
Editorial Collage Hero
474
Split Hero With Image Cards
436
Editorial Image Hero
402
Scroll 01
380
Real Estate Search Hero
206
Editorial Hero
191
Hero with Dashboard Mockup
137
More in Dashboards
View all
Dashboard with Collapsible Sidebar
2.5K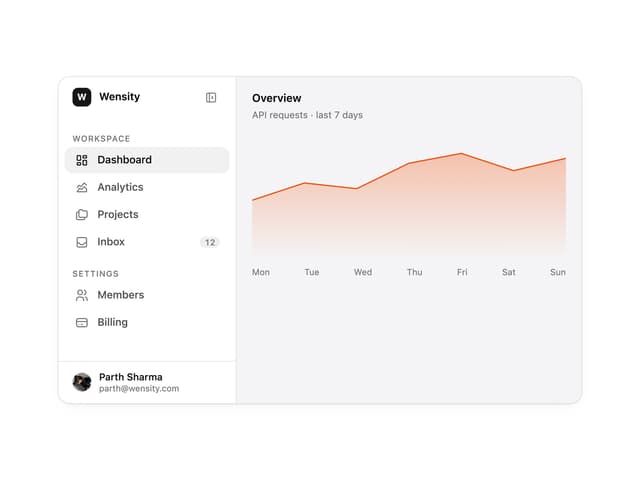

Sidebar
342

SaaS Template
2.6K

Course Design Cards
1.2K
Stats cards with links
128
Stats Bento
1.2K

Chat template
639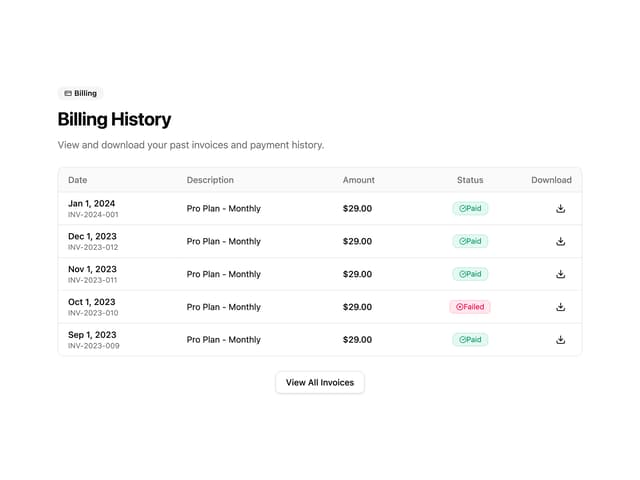

Invoice History Table
84


