About
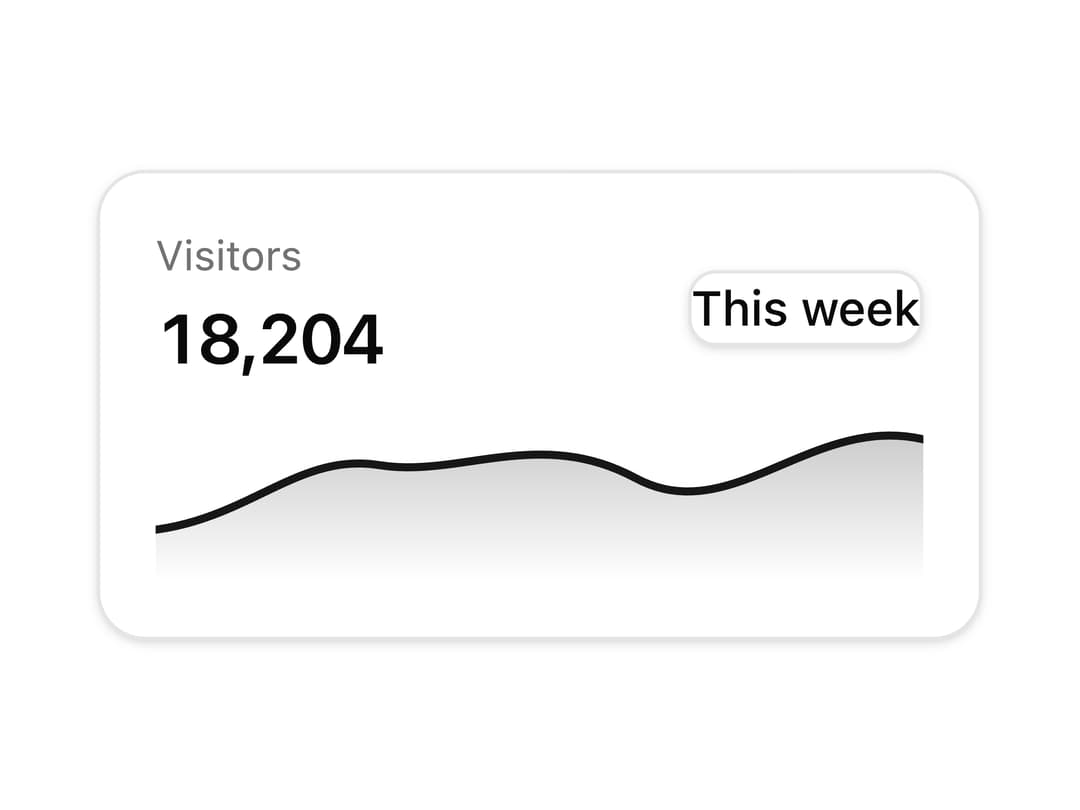
A small analytics card that shows a metric with a gradient area-chart sparkline and a time-range button, used for dashboard widgets.
Built with React and Tailwind. Copy the prompt and paste it into Claude Code, Cursor or Lovable: your agent adds Analytics Spot Card to your project and fits it to your theme.
Code
How Analytics Spot Card is used: the demo's code. The component's own source comes with a free account.
Usage.tsx
import Spot04 from "@/components/ui/spot-04";

export default function SpotDemo() {
  return (
    <div className="flex items-center justify-center p-10">
      <Spot04 />
    </div>
  );
}
More by felipemenezes098
View all
Centered Hero with Image Fan
1K
Editorial Collage Hero
474
Split Hero With Image Cards
436
Editorial Image Hero
402
Scroll 01
380
Real Estate Search Hero
206
Editorial Hero
191
Hero with Dashboard Mockup
137
More in Cards
View all

Course Design Cards
1.2K
Stats cards with links
128

Interactive Tech Stack Bento Grid with Hover Effects
396

Card Studio
14

Statistics Card 2
291
Statistics Card 10
280
Card
70
The Item one
3
