
About
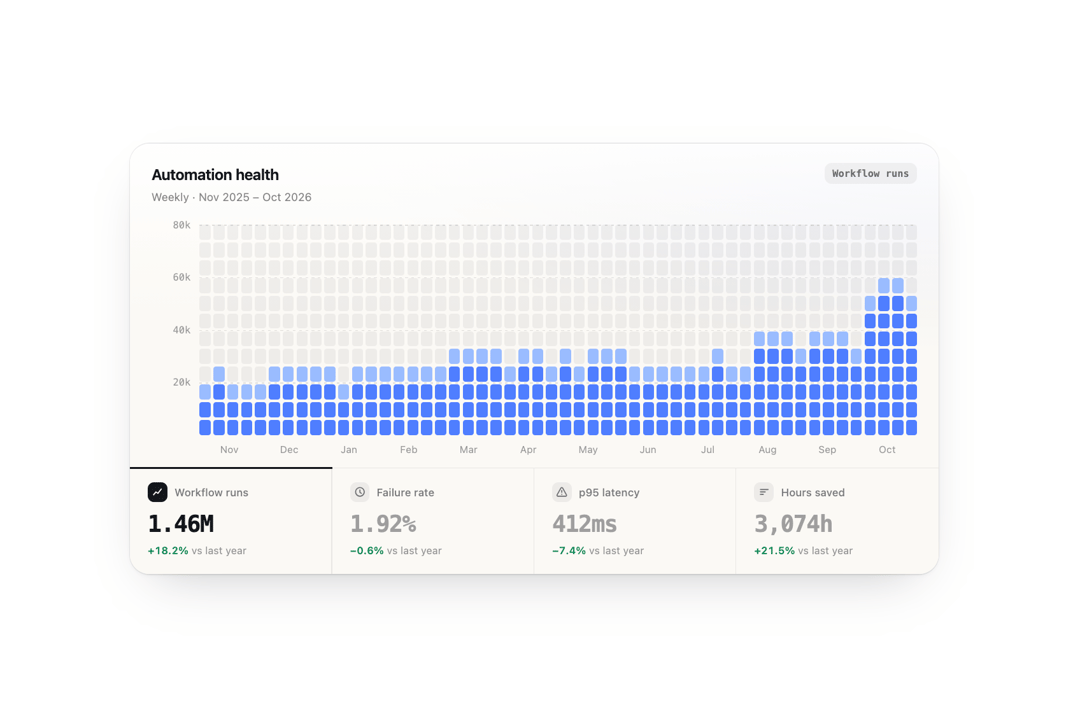
Animated bar chart dashboard: a performance chart of stacked cells where KPI tabs flip the board to a new metric in a diagonal wave, the axis rolls to its new scale and hovering a column shows a tooltip. For analytics and admin dashboards.
Built with React and Tailwind. Copy the prompt and paste it into Claude Code, Cursor or Lovable: your agent adds Animated Bar Chart Dashboard to your project and fits it to your theme.
Code
How Animated Bar Chart Dashboard is used: the demo's code. The component's own source comes with a free account.
Usage.tsx
import CellColumnTrend from "@/components/ui/cell-column-trend"

// A year of weekly numbers for a workflow-automation product: steady growth,
// a summer lull, a launch in October, and a bad incident week in March.
const weeks = 52
const noise = (i: number, s: number) => ((Math.sin(i * 12.9898 + s * 78.233) * 43758.5453) % 1 + 1) % 1
const labels = Array.from({ length: weeks }, (_, i) => {
  const d = new Date(Date.UTC(2025, 10, 3) + i * 7 * 864e5)
  return "Wk of " + d.toLocaleDateString("en-US", { month: "short", day: "numeric", timeZone: "UTC" })
})
const runs = Array.from({ length: weeks }, (_, i) => {
  const summer = i > 30 && i < 40 ? 0.78 : 1
  const launch = i >= 48 ? 1.35 : 1
  return Math.round((22000 + i * 380) * summer * launch * (0.86 + noise(i, 1) * 0.28))
})
const failRate = runs.map((_, i) => (i === 19 || i === 20 ? 6.8 - (i - 19) * 2.4 : 1.1 + noise(i, 2) * 1.6))
const latency = runs.map((_, i) => Math.round(i === 19 ? 640 : i === 20 ? 470 : 230 + noise(i, 3) * 120 + Math.sin(i / 5) * 40 - (i > 40 ? 50 : 0)))
const saved = runs.map((r) => Math.round(r * 0.0021))

const metrics = [
  { key: "runs", label: "Workflow runs", values: runs, summary: "1.46M", delta: 18.2, format: (n: number) => (n >= 1000 ? Math.round(n / 1000) + "k" : String(Math.round(n))) },
  { key: "fail", label: "Failure rate", values: failRate, summary: "1.92%", delta: -0.6, higherIsBetter: false, format: (n: number) => n.toFixed(1) + "%" },
  { key: "p95", label: "p95 latency", values: latency, summary: "412ms", delta: -7.4, higherIsBetter: false, format: (n: number) => Math.round(n) + "ms" },
  { key: "saved", label: "Hours saved", values: saved, summary: "3,074h", delta: 21.5, format: (n: number) => Math.round(n) + "h" },
]

export default function Demo() {
  return (
    <div className="flex min-h-svh w-full items-center justify-center bg-background p-4 sm:p-10">
      <CellColumnTrend
        title="Automation health"
        caption="Weekly · Nov 2025 – Oct 2026"
        metrics={metrics}
        labels={labels}
        ticks={["Nov", "Dec", "Jan", "Feb", "Mar", "Apr", "May", "Jun", "Jul", "Aug", "Sep", "Oct"]}
      />
    </div>
  )
}
More by Kedhareswer Naidu
View all

Glassmorphism Folder Cards
3.9K
GitHub Contribution Graph 3D Heatmap
1.9K
Halftone Wordmark Footer
1.8K
Morph Gallery
1.6K
Hanging Polaroid Image Carousel
1.1K
Animated Features Bento with Live Diagrams
940
Glass Cards
769
Tiger Tear Reveal
706
More in Dashboards
View all
Dashboard with Collapsible Sidebar
2.5K

Sidebar
320

SaaS Template
2.5K
Rate Limit Meter
29
Stats Bento
1.2K

Course Design Cards
1.2K

Chat template
632
Adjustable Glass Dashboard
2


