
About
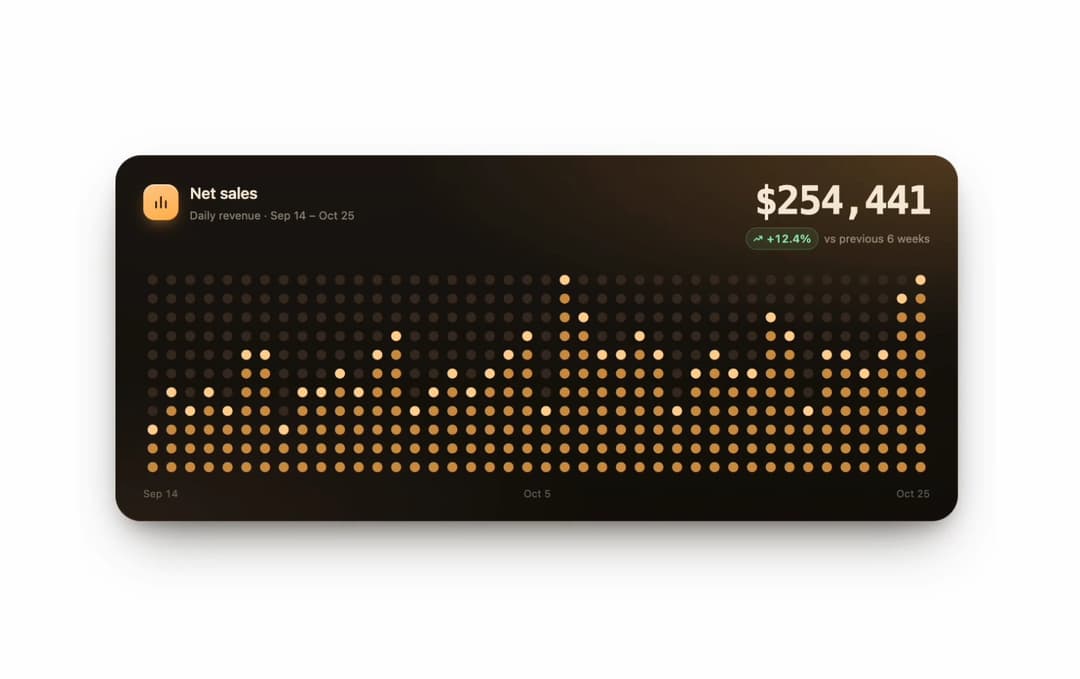
LED dot matrix chart card: a revenue card whose chart is a board of LED dots, lighting each day's column from the bottom with a bright top dot, sweeping on in view while the total rolls up like an odometer. For dashboards and sales stats.
Built with React and Tailwind. Copy the prompt and paste it into Claude Code, Cursor or Lovable: your agent adds LED Dot Matrix Chart Card to your project and fits it to your theme.
Code
How LED Dot Matrix Chart Card is used: the demo's code. The component's own source comes with a free account.
Usage.tsx
import LedMatrixSales from "@/components/ui/led-matrix-sales"

// Six weeks of a small shop's daily takings: soft Mondays, strong weekends,
// and a launch spike in week four.
const start = Date.UTC(2026, 8, 14)
const data = Array.from({ length: 42 }, (_, i) => {
  const day = new Date(start + i * 864e5)
  const dow = day.getUTCDay()
  const weekend = dow === 0 || dow === 6 ? 1.45 : dow === 1 ? 0.7 : 1
  const trend = 1 + i * 0.012
  const wobble = 0.85 + ((Math.sin(i * 12.9898) * 43758.5453) % 1 + 1) % 1 * 0.3
  const launch = i >= 22 && i <= 25 ? 1.9 - (i - 22) * 0.22 : 1
  return {
    label: day.toLocaleDateString("en-US", { month: "short", day: "numeric", timeZone: "UTC" }),
    value: Math.round(4200 * weekend * trend * wobble * launch),
  }
})

export default function Demo() {
  return (
    <div className="flex min-h-svh w-full items-center justify-center bg-background p-4 sm:p-10">
      <LedMatrixSales data={data} rows={11} title="Net sales" caption="Daily revenue · Sep 14 – Oct 25" delta={12.4} deltaLabel="vs previous 6 weeks" />
    </div>
  )
}
More by Kedhareswer Naidu
View all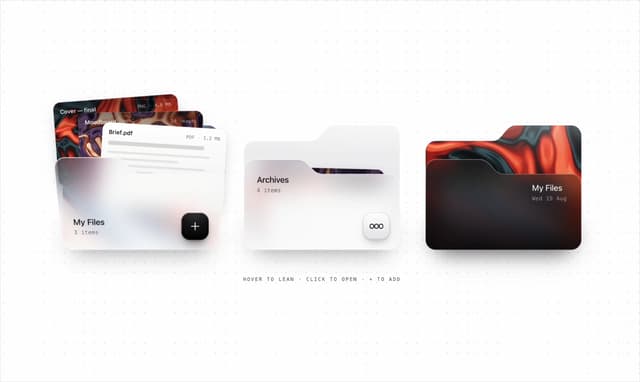

Glassmorphism Folder Cards
3.9K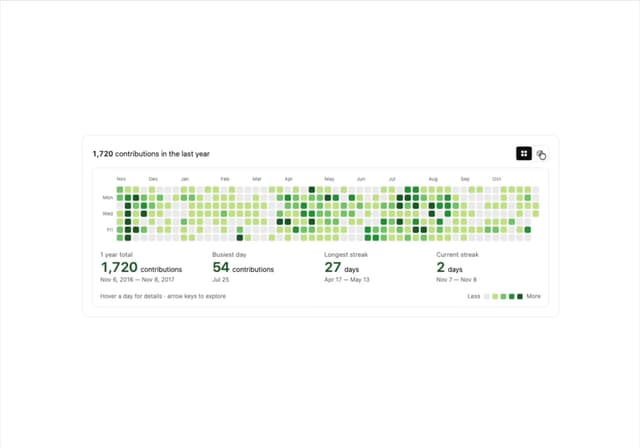
GitHub Contribution Graph 3D Heatmap
1.9K
Halftone Wordmark Footer
1.8K
Morph Gallery
1.6K
Hanging Polaroid Image Carousel
1.1K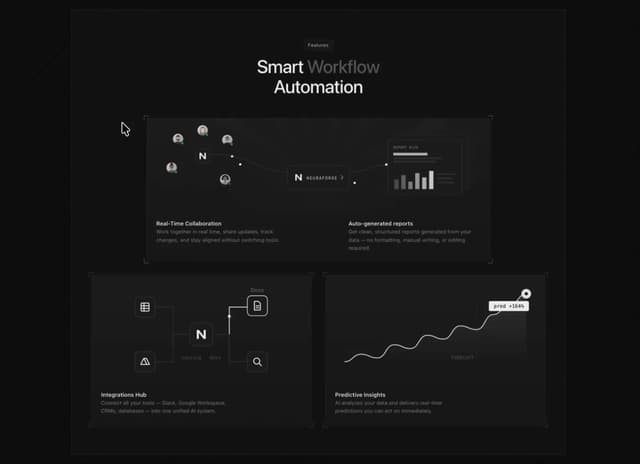
Animated Features Bento with Live Diagrams
937
Glass Cards
769
Tiger Tear Reveal
705
More in Cards
View all

Course Design Cards
1.2K

Card Studio
11

Card
70

Interactive Tech Stack Bento Grid with Hover Effects
328
Statistics Card 2
283
Stats cards with links
87
Statistics Card 10
277
The Item one
3
