
About
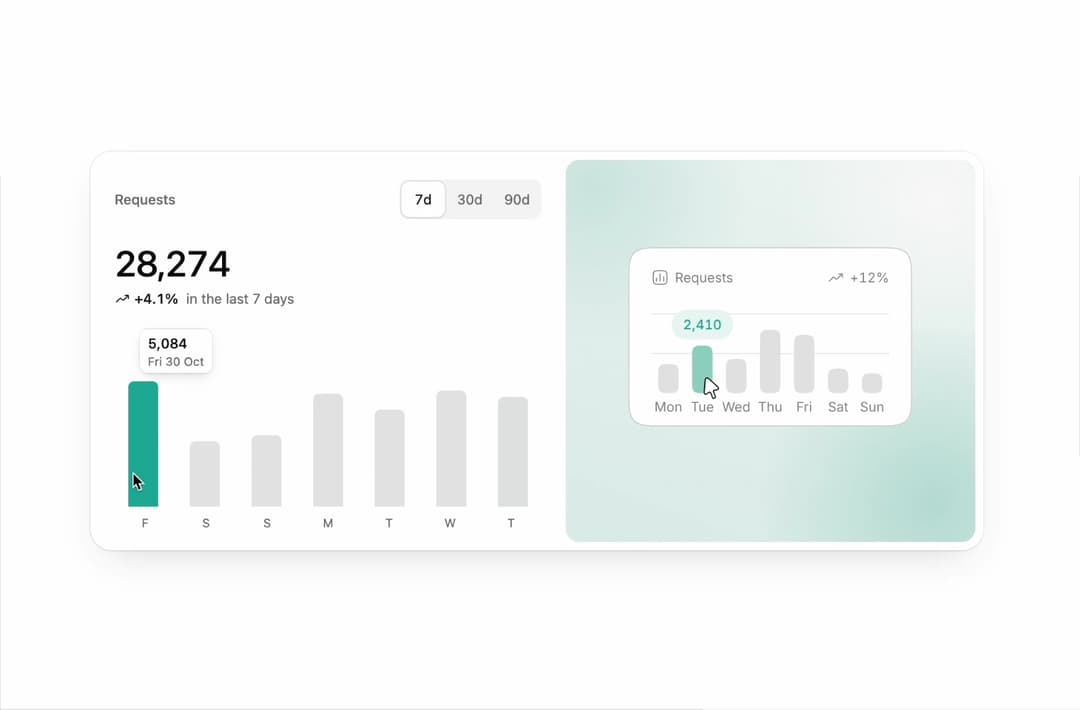
KPI card with a 7, 30 or 90 day range, its change and a bar chart you can step through, beside an animated Interface chart illustration from Illos. Light and dark with your theme tokens. Code is MIT; the illustration is under the Illos free license (illos.dev/license).
Built with React and Tailwind. Copy the prompt and paste it into Claude Code, Cursor or Lovable: your agent adds Illos Stats Card to your project and fits it to your theme.
Code
How Illos Stats Card is used: the demo's code. The component's own source comes with a free account.
Usage.tsx
import { IllosStatsCard } from "@/components/ui/illos-stats-card";

export default function Demo() {
  return (
    <div className="flex min-h-[640px] w-full items-center justify-center bg-background px-4 py-10 sm:px-8">
      <IllosStatsCard />
    </div>
  );
}
More by Naved
View all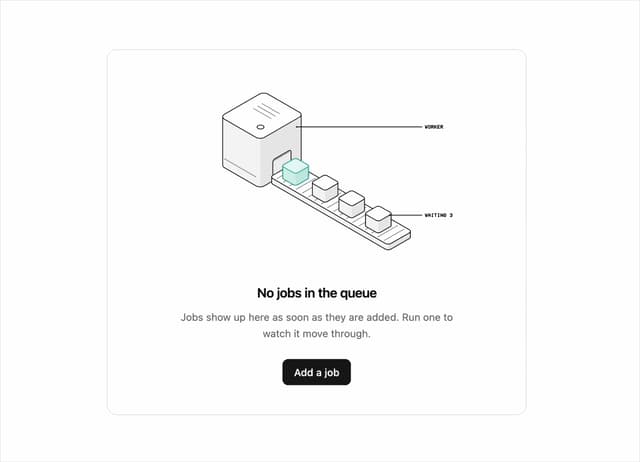
Illos Queue Empty State
56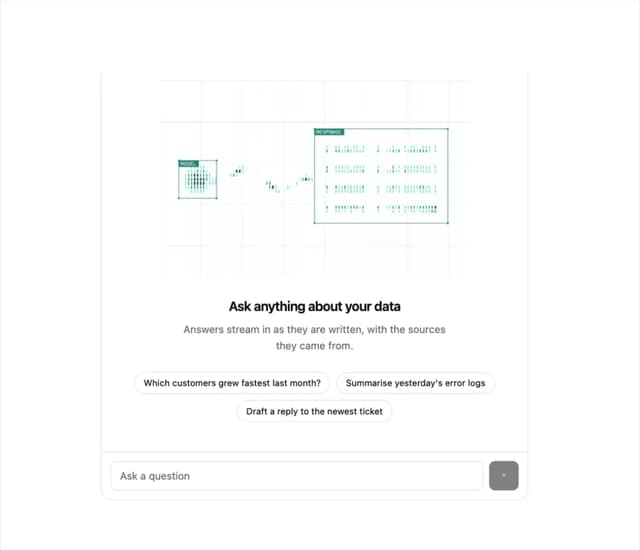
Illos AI Chat Empty State
23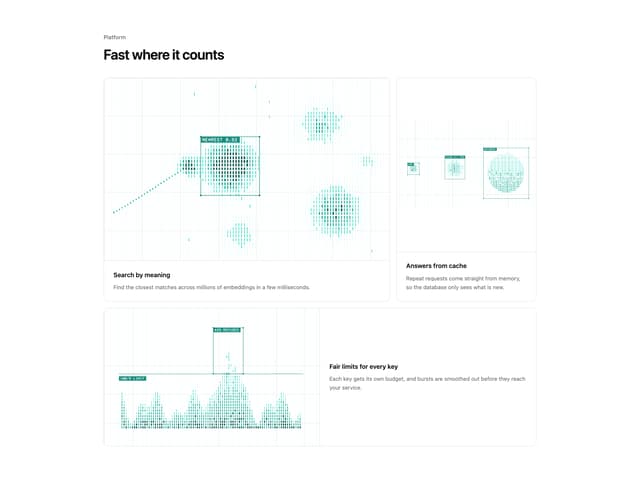
Illos Shader Feature Bento
23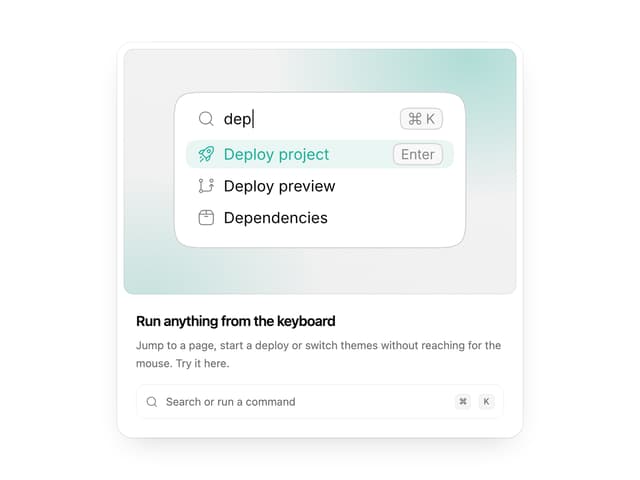
Illos Command Palette
22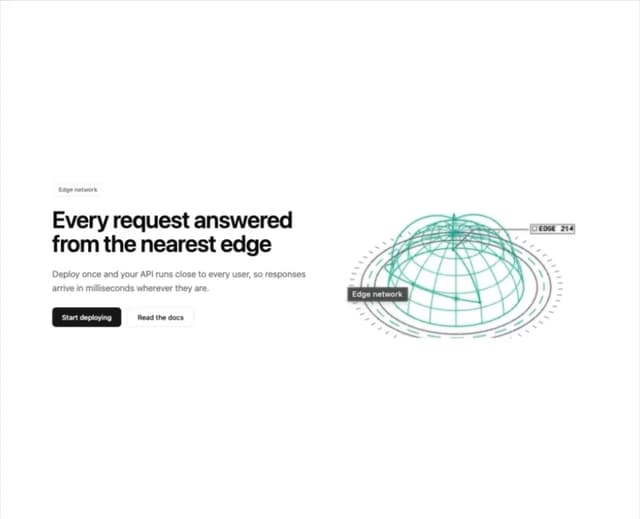
Illos Edge Hero
20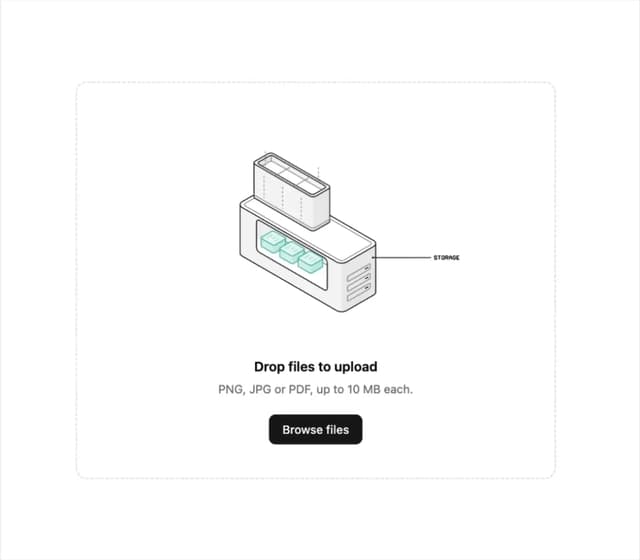
Illos Upload Dropzone
15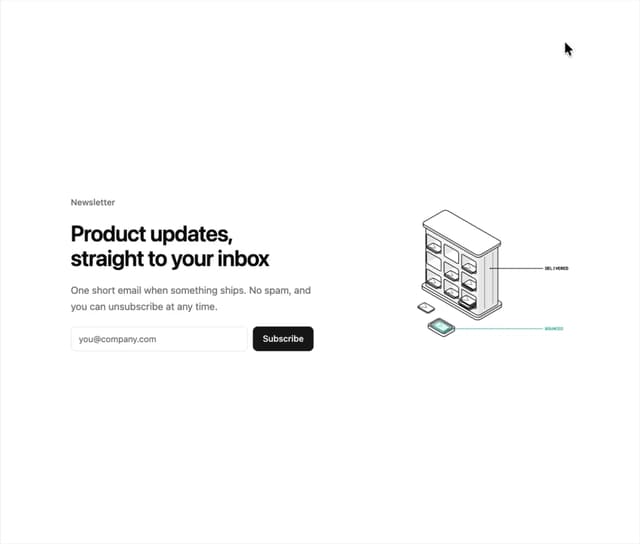
Illos Email Signup
11
Illos Usage Pricing
10