
About
An animated area chart that renders its fill as a drifting aurora curtain, with a cool-to-warm hue band tracking whether the series is rising or falling and a tooltip that follows the nearest data point.
Built with React and Tailwind. Copy the prompt and paste it into Claude Code, Cursor or Lovable: your agent adds Aurora Flow Chart to your project and fits it to your theme.
Code
How Aurora Flow Chart is used: the demo's code. The component's own source comes with a free account.
Usage.tsx
"use client";

import AuroraFlowChart from "@/components/ui/chart-area-aurora";

export default function AuroraFlowChartDemo() {
  return (
    <div className="flex w-full items-center justify-center bg-background p-8">
      <div className="w-full max-w-2xl">
        <AuroraFlowChart />
      </div>
    </div>
  );
}
More by nikolas-sapa
View all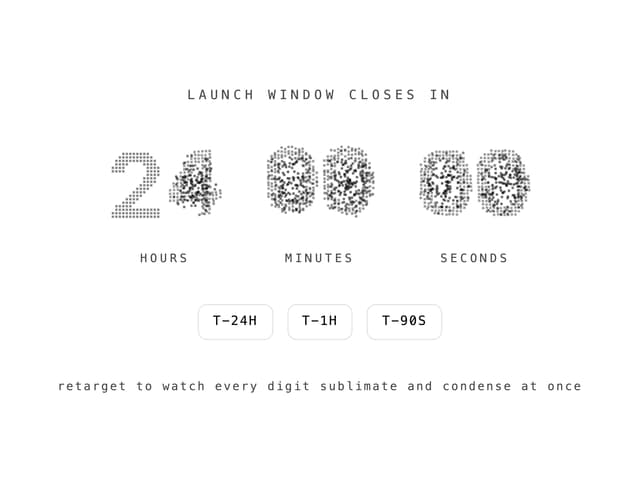

Countdown Vapor Digits
162
Dye Whorl
154
Background ASCII Wake
70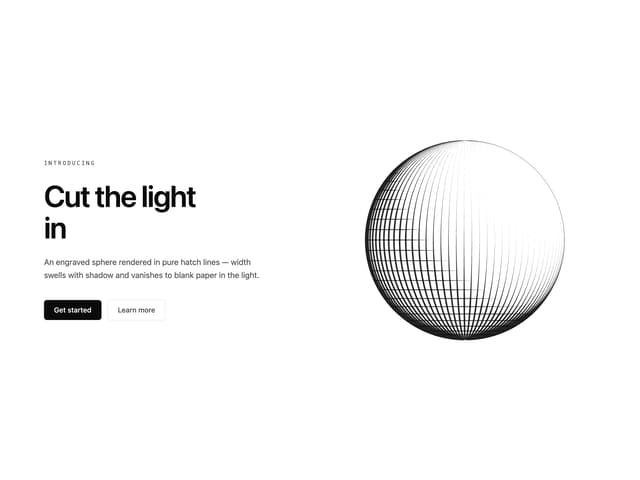
Hero Burin Hatch
68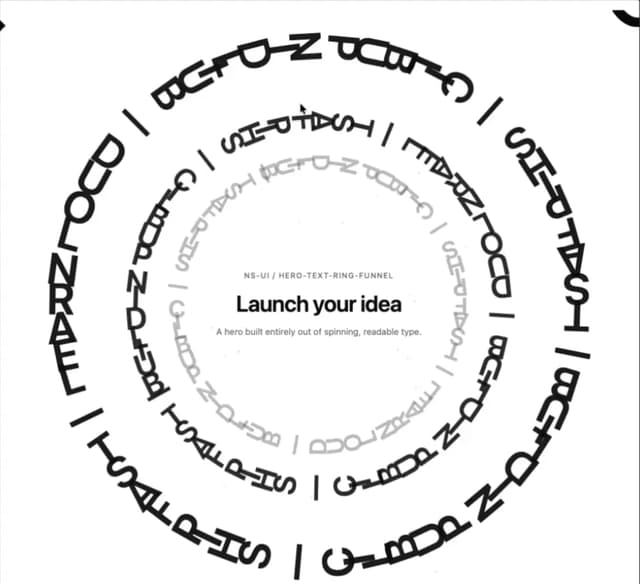
Hero Text Ring Funnel
56
Hero ASCII Schlieren
56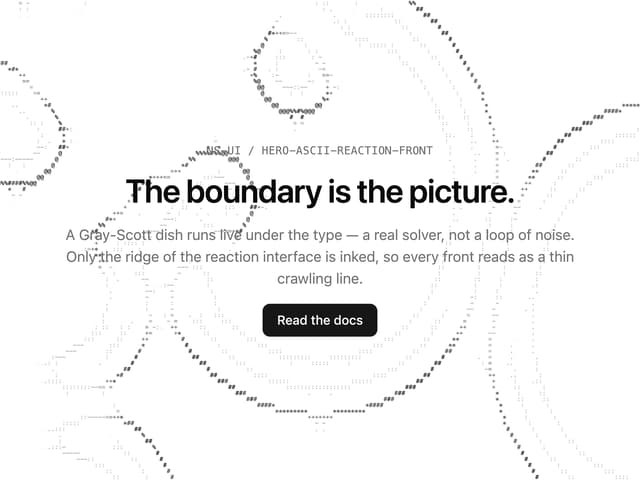
Hero ASCII Reaction Front
55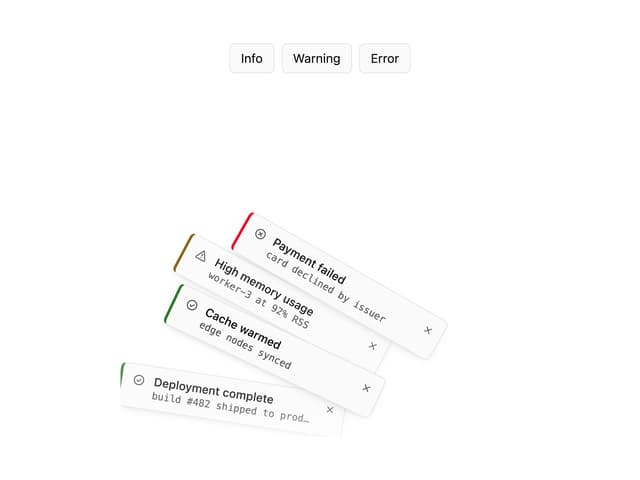
Toast Gravity Stack
54
More in Dashboards
View all
Dashboard with Collapsible Sidebar
2.5K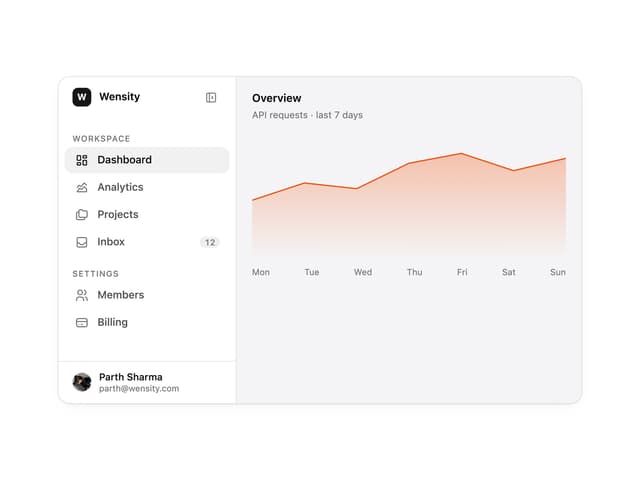

Sidebar
334

SaaS Template
2.6K

Card
230
Stats Bento
1.2K

Course Design Cards
1.2K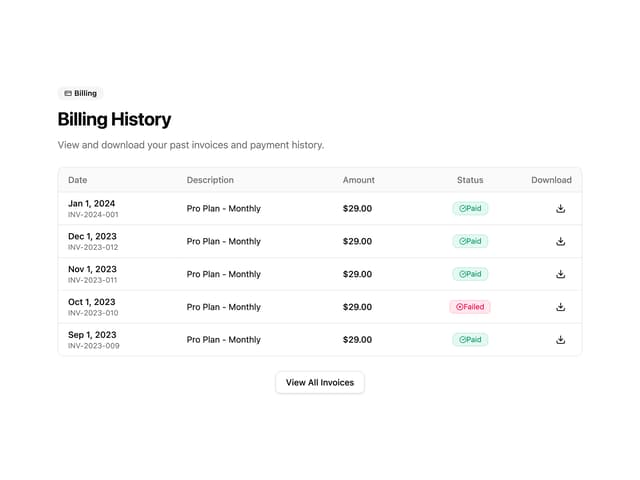

Invoice History Table
82

Data Grid Table
15

