
About
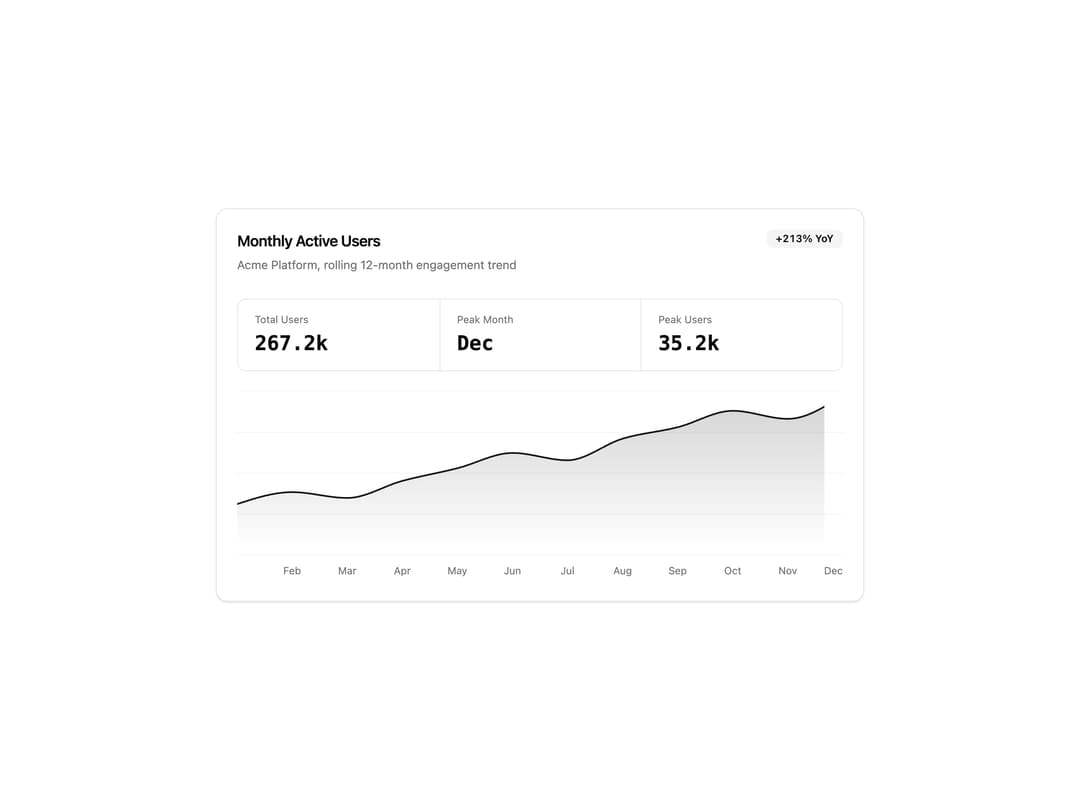
A gradient area chart showing a 12-month active-users trend with a total/peak-month/peak-users KPI row and a year-over-year growth badge.
Built with React and Tailwind. Copy the prompt and paste it into Claude Code, Cursor or Lovable: your agent adds Active Users Area Chart to your project and fits it to your theme.
Code
How Active Users Area Chart is used: the demo's code. The component's own source comes with a free account.
Usage.tsx
import ChartsBlock from "@/components/ui/charts-2";

export default function Preview() {
  return <ChartsBlock />;
}
Dependencies
More by Oliver
View all
Dismissible Alert Stack
400
Us vs Them Comparison
350
Feature Comparison Table
260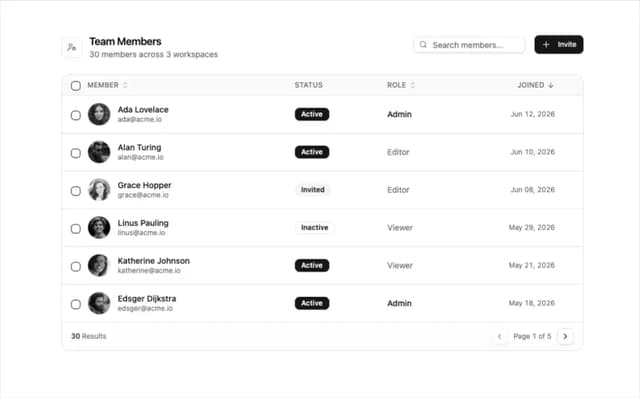
Team Members Data Table
218
How It Works Timeline
211
Alternating Rows With Stats
107
Logo Cloud Marquee
105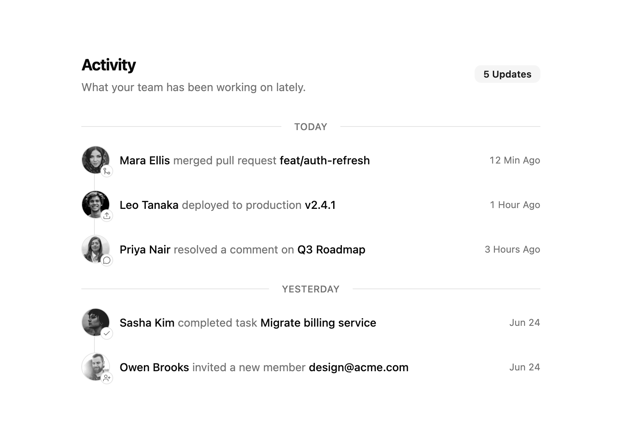
Activity Timeline
89
More in Dashboards
View all
Dashboard with Collapsible Sidebar
2.5K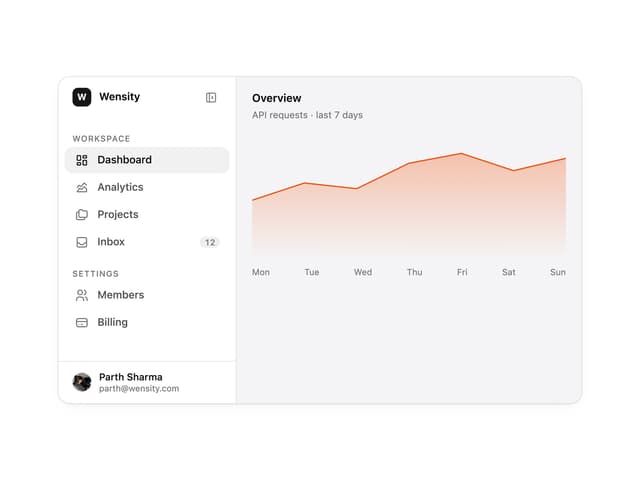

Sidebar
332

SaaS Template
2.6K

Card
229
Stats Bento
1.2K

Course Design Cards
1.2K

Invoice History Table
82

Data Grid Table
15

