
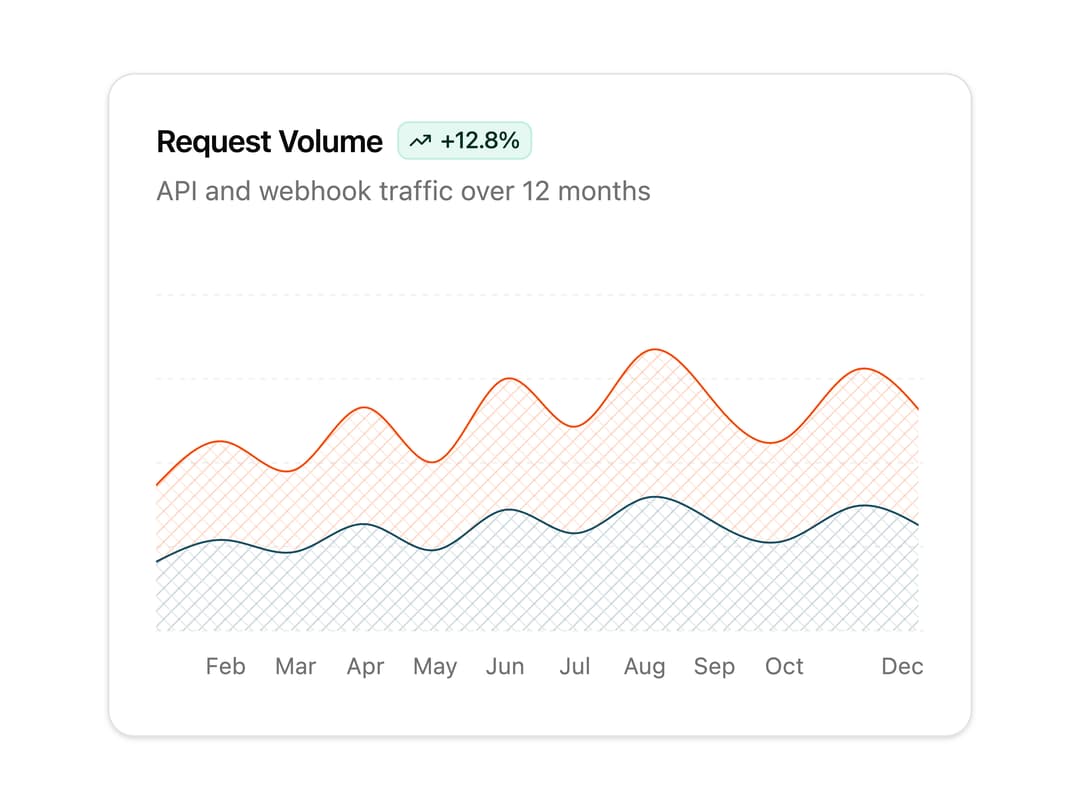
About
A stacked area chart with a crosshatch pattern fill for comparing two time-series metrics, such as API calls versus webhook traffic over a year.
Built with React and Tailwind. Copy the prompt and paste it into Claude Code, Cursor or Lovable: your agent adds Crosshatch Area Chart to your project and fits it to your theme.
Code
How Crosshatch Area Chart is used: the demo's code. The component's own source comes with a free account.
Usage.tsx
import Component from "@/components/ui/c-chart-18";

export default function Demo() {
  return (
    <div className="flex w-full items-center justify-center p-10">
      <Component />
    </div>
  );
}
Dependencies
More by Sean Hello
View all

3D Testimonails
3.5K
Line Charts 9
667
Alert
495
Line Charts 6
397
Area Charts 1
392
Scroll Area
378
Navigation Menu
325
Area Charts 2
318
More in Dashboards
View all
Dashboard with Collapsible Sidebar
2.5K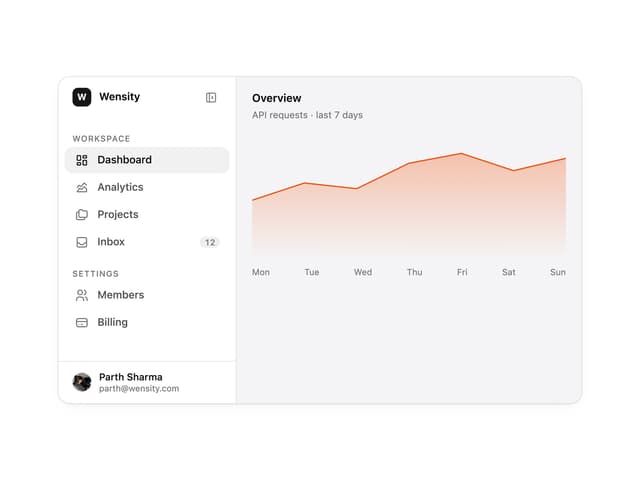

Sidebar
310

SaaS Template
2.5K
Stats Bento
1.1K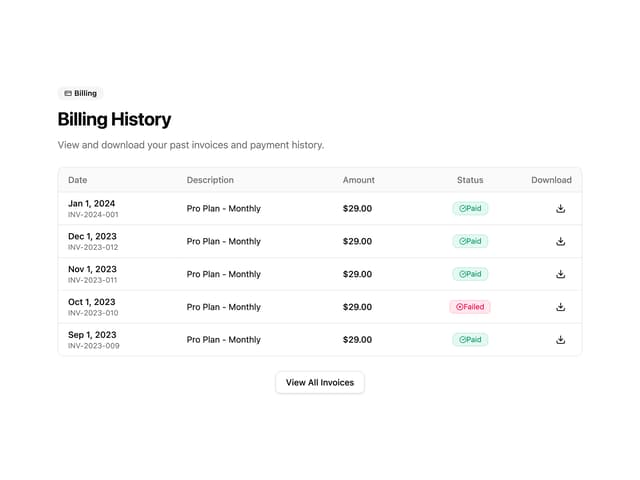

Invoice History Table
81

Course Design Cards
1.1K
Data Grid Table
11

Bar Chart
17

