
About
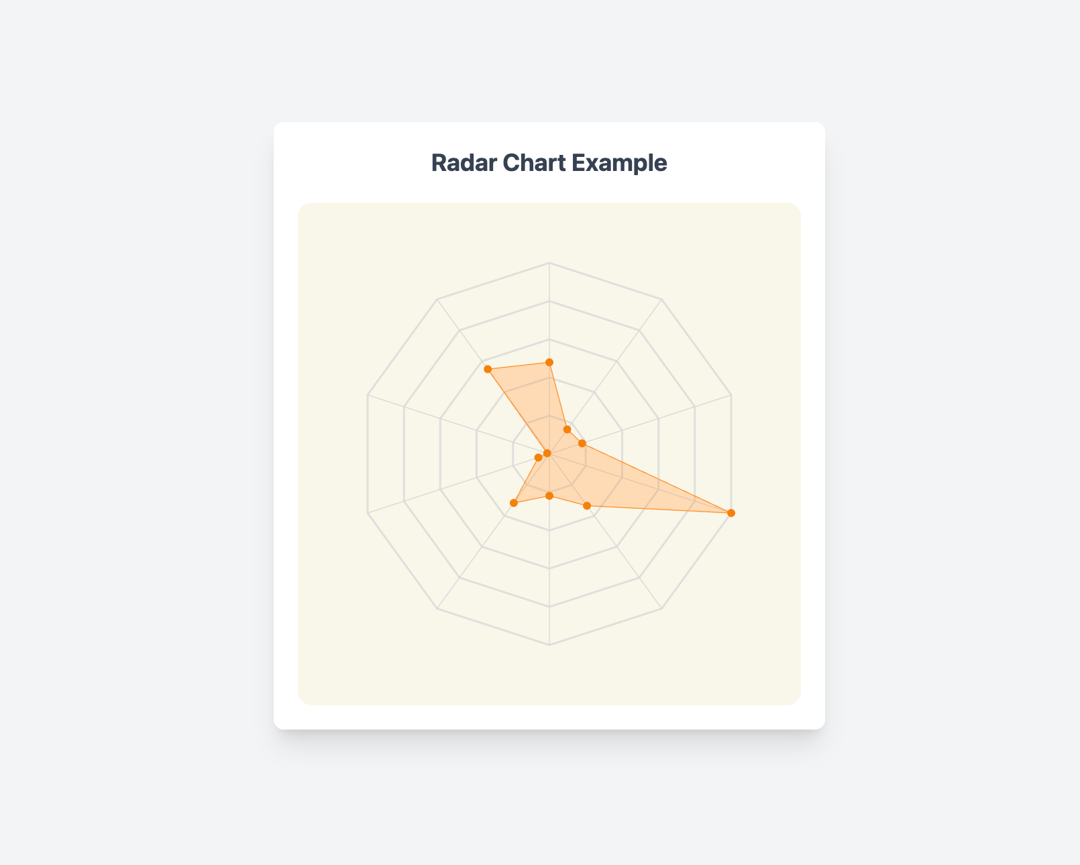
Here is radar chart example
Built with React and Tailwind. Copy the prompt and paste it into Claude Code, Cursor or Lovable: your agent adds Radar chart to your project and fits it to your theme.
Code
How Radar chart is used: the demo's code. The component's own source comes with a free account.
Usage.tsx
// src/demo.tsx
import React from 'react';
import { Component } from "@/components/ui/radar-chart";
import { letterFrequency, LetterFrequency } from '@visx/mock-data';
import { cn } from "@/lib/utils";
const demoData = letterFrequency.slice(2, 12);

const getValueAccessor = (d: LetterFrequency): number => d.frequency;

const DemoOne = () => {
  return (
    <div className={cn("flex w-full min-h-screen justify-center items-center p-4 bg-gray-100")}>
      <div className="bg-white p-6 rounded-lg shadow-xl">
        <h1 className="text-2xl font-bold mb-6 text-center text-gray-700">Radar Chart Example</h1>
        <Component
          width={500}
          height={500}
          data={demoData}
          getValue={getValueAccessor}
          levels={5}
          margin={{ top: 60, right: 60, bottom: 60, left: 60 }}
        />
      </div>
    </div>
  );
};

export { DemoOne };
Dependencies
More by Airbnb
View all
Heatmaps
101
Pie chart
99
Linktypes
94
Finance Chart
83
Word cloud
62
Streamgraph
50
Tooltip
49
Legends
44