
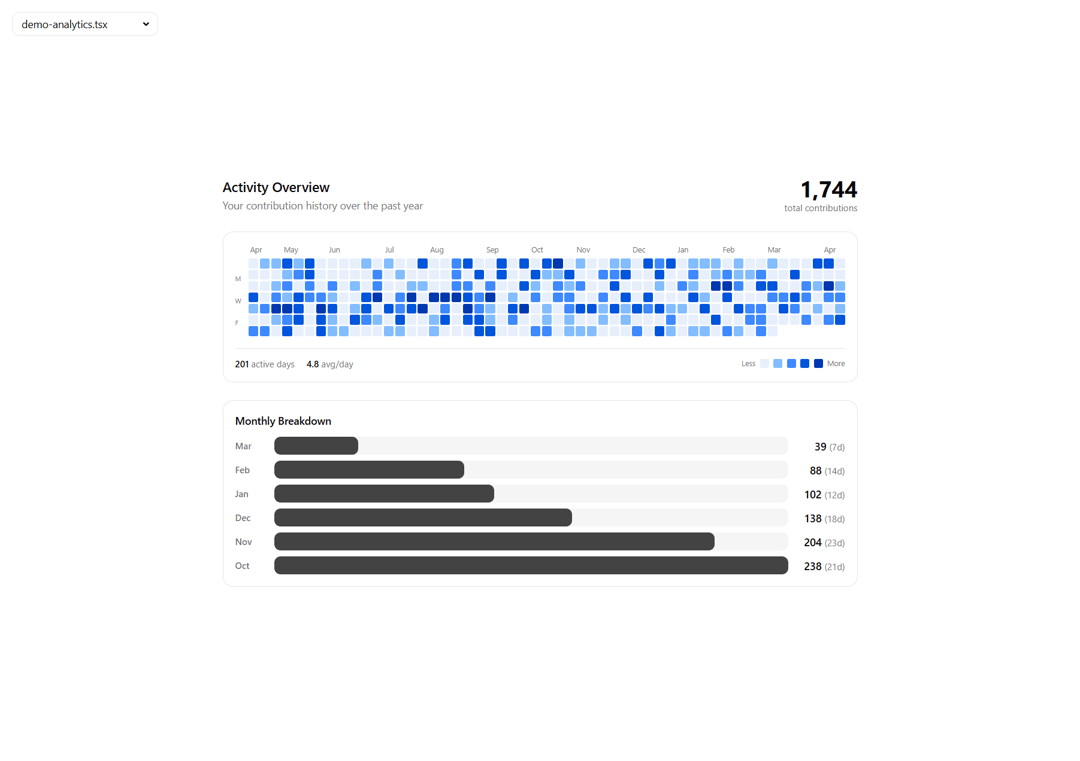
About
A composable, customizable contribution graph component inspired by GitHub's activity heatmap. Features composable subcomponents (Grid, Tooltip, Legend), CSS variable theming, configurable cell sizes, interactive tooltips with custom render functions, and full dark mode support.
Built with React and Tailwind. Copy the prompt and paste it into Claude Code, Cursor or Lovable: your agent adds Contribution Graph to your project and fits it to your theme.
Code
How Contribution Graph is used: the demo's code. The component's own source comes with a free account.
Usage.tsx
// Analytics dashboard demo with monthly breakdown

import {
  ContributionGraph,
  ContributionGraphGrid,
  ContributionGraphTooltip,
  ContributionGraphLegend,
  type ContributionData,
} from "@/components/ui/contribution-graph";

function generateSampleData(): ContributionData[] {
  const data: ContributionData[] = [];
  const endDate = new Date();
  const startDate = new Date();
  startDate.setFullYear(startDate.getFullYear() - 1);

  const current = new Date(startDate);
  while (current <= endDate) {
    const dayOfWeek = current.getDay();
    const month = current.getMonth();
    const isWeekend = dayOfWeek === 0 || dayOfWeek === 6;

    // Simulate seasonal patterns - more activity in certain months
    const seasonalMultiplier =
      month >= 8 && month <= 11 ? 1.3 : month >= 3 && month <= 5 ? 1.1 : 0.9;
    const baseChance = (isWeekend ? 0.3 : 0.6) * seasonalMultiplier;

    if (Math.random() < baseChance) {
      data.push({
        date: current.toISOString().split("T")[0],
        count: Math.floor(Math.random() * 15 * seasonalMultiplier) + 1,
      });
    }
    current.setDate(current.getDate() + 1);
  }
  return data;
}

const sampleData = generateSampleData();
const endDate = new Date();
const startDate = new Date();
startDate.setFullYear(startDate.getFullYear() - 1);
startDate.setDate(startDate.getDate() + 1);

// Calculate monthly stats
const monthlyStats = (() => {
  const months: Record<string, { count: number; days: number }> = {};

  sampleData.forEach((d) => {
    const monthKey = d.date.substring(0, 7); // YYYY-MM
    if (!months[monthKey]) {
      months[monthKey] = { count: 0, days: 0 };
    }
    months[monthKey].count += d.count;
    months[monthKey].days += 1;
  });

  return Object.entries(months)
    .sort(([a], [b]) => b.localeCompare(a))
    .slice(0, 6)
    .map(([month, stats]) => ({
      month: new Date(month + "-01").toLocaleDateString("en-US", {
        month: "short",
      }),
      ...stats,
    }));
})();

const totalContributions = sampleData.reduce((sum, d) => sum + d.count, 0);
const maxMonthly = Math.max(...monthlyStats.map((m) => m.count));

export default function DemoAnalytics() {
  return (
    <div className="w-full max-w-4xl p-6 space-y-6">
      {/* Header */}
      <div className="flex items-center justify-between">
        <div>
          <h3 className="text-lg font-semibold text-foreground">
            Activity Overview
          </h3>
          <p className="text-sm text-muted-foreground">
            Your contribution history over the past year
          </p>
        </div>
        <div className="text-right">
          <div className="text-3xl font-bold text-foreground tabular-nums">
            {totalContributions.toLocaleString()}
          </div>
          <div className="text-xs text-muted-foreground">total contributions</div>
        </div>
      </div>

      {/* Graph */}
      <div
        className="rounded-xl border bg-card p-4"
        style={{
          "--contribution-empty": "oklch(0.95 0.02 260)",
          "--contribution-level-1": "oklch(0.8 0.15 260)",
          "--contribution-level-2": "oklch(0.65 0.2 260)",
          "--contribution-level-3": "oklch(0.5 0.22 260)",
          "--contribution-level-4": "oklch(0.4 0.2 260)",
        } as React.CSSProperties}
      >
        <ContributionGraph
          data={sampleData}
          startDate={startDate.toISOString().split("T")[0]}
          endDate={endDate.toISOString().split("T")[0]}
          formatCount={(count) => `${count} events`}
        >
          <ContributionGraphGrid />
          <ContributionGraphTooltip className="backdrop-blur-sm bg-popover/95" />
          <div className="mt-4 flex items-center justify-between border-t pt-3">
            <div className="flex items-center gap-4 text-xs text-muted-foreground">
              <span>
                <span className="font-medium text-foreground">
                  {sampleData.length}
                </span>{" "}
                active days
              </span>
              <span>
                <span className="font-medium text-foreground">
                  {(totalContributions / 365).toFixed(1)}
                </span>{" "}
                avg/day
              </span>
            </div>
            <ContributionGraphLegend />
          </div>
        </ContributionGraph>
      </div>

      {/* Monthly Breakdown */}
      <div className="rounded-xl border bg-card p-4">
        <h4 className="text-sm font-medium text-foreground mb-3">
          Monthly Breakdown
        </h4>
        <div className="space-y-2">
          {monthlyStats.map((stat) => (
            <div key={stat.month} className="flex items-center gap-3">
              <div className="w-10 text-xs text-muted-foreground font-medium">
                {stat.month}
              </div>
              <div className="flex-1 h-6 bg-muted rounded-md overflow-hidden">
                <div
                  className="h-full bg-primary/80 rounded-md transition-all duration-500"
                  style={{ width: `${(stat.count / maxMonthly) * 100}%` }}
                />
              </div>
              <div className="w-16 text-right">
                <span className="text-sm font-medium text-foreground tabular-nums">
                  {stat.count}
                </span>
                <span className="text-xs text-muted-foreground ml-1">
                  ({stat.days}d)
                </span>
              </div>
            </div>
          ))}
        </div>
      </div>
    </div>
  );
}
More by Bankk roll
View all
Animated Testimonials
1.1K
Commerce Hero
678
Acme Hero
453
Myna Hero
394
Single Pricing Card
307
Pricing Card
291
File Viewer
178
Code Editor Sheet
142
More in Dashboards
View all
Dashboard with Collapsible Sidebar
2.6K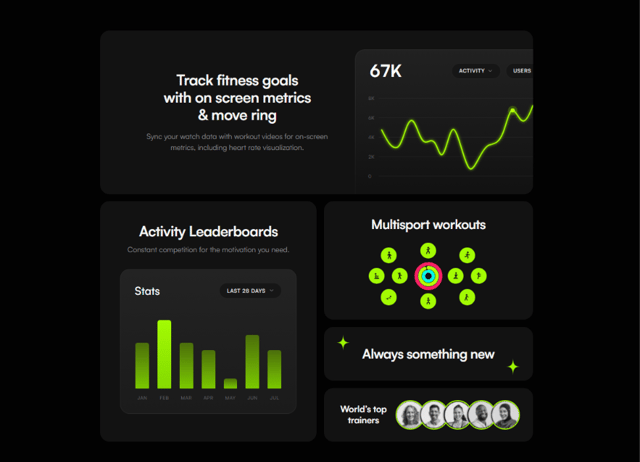
Fitness Bento Grid
12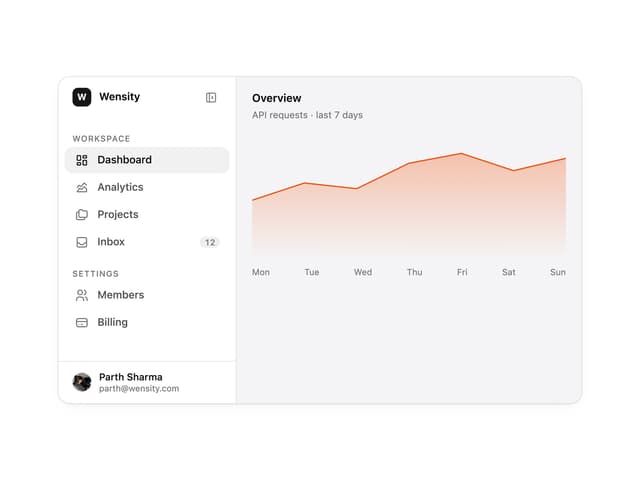

Sidebar
362

SaaS Template
2.6K

Chat template
653

Card
249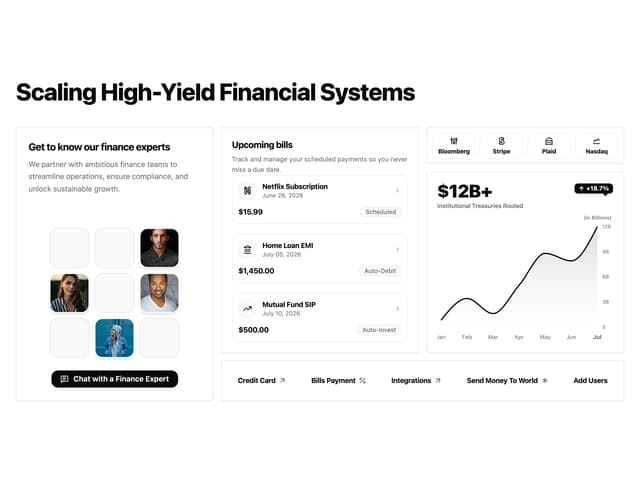

Financial Bento Grid
117
Stats cards with links
94


