
About
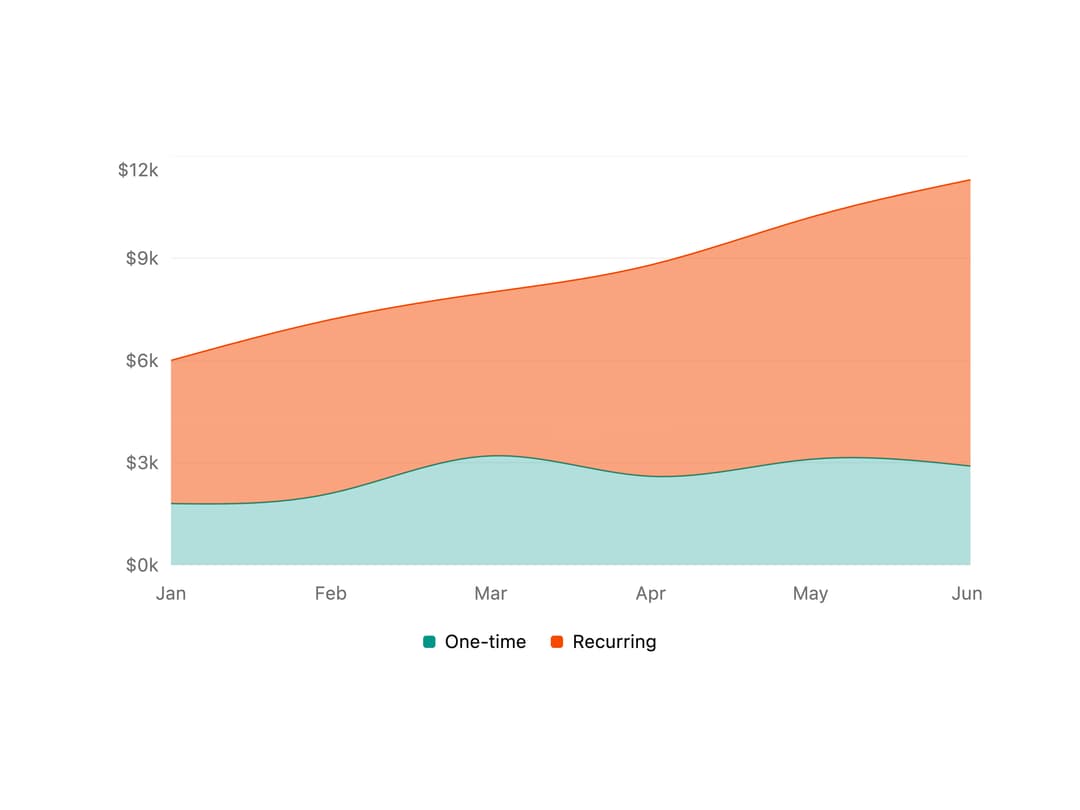
A stacked area chart that visualizes two revenue series (one-time vs recurring) over time with a Y-axis legend and tooltip.
Built with React and Tailwind. Copy the prompt and paste it into Claude Code, Cursor or Lovable: your agent adds Stacked Revenue Area Chart to your project and fits it to your theme.
Code
How Stacked Revenue Area Chart is used: the demo's code. The component's own source comes with a free account.
Usage.tsx
import Pattern from "@/components/ui/v-chart-11";

export default function Demo() {
  return (
    <div className="w-full max-w-xl">
      <Pattern />
    </div>
  );
}
Dependencies
More by Cnippet
View all

Team
1.3K
Davincho Hero-1
692
Aero Hero-3
590
Features
520
Random Letter Swap Navigation
514
Services with Animated Hover Modal
472
Blogs
398
Aero Hero-1
367
More in Dashboards
View all
Dashboard with Collapsible Sidebar
2.5K

Sidebar
326

SaaS Template
2.5K

Card
228

Course Design Cards
1.2K
Stats Bento
1.2K

Chat template
632
Stats cards with links
89


