
About
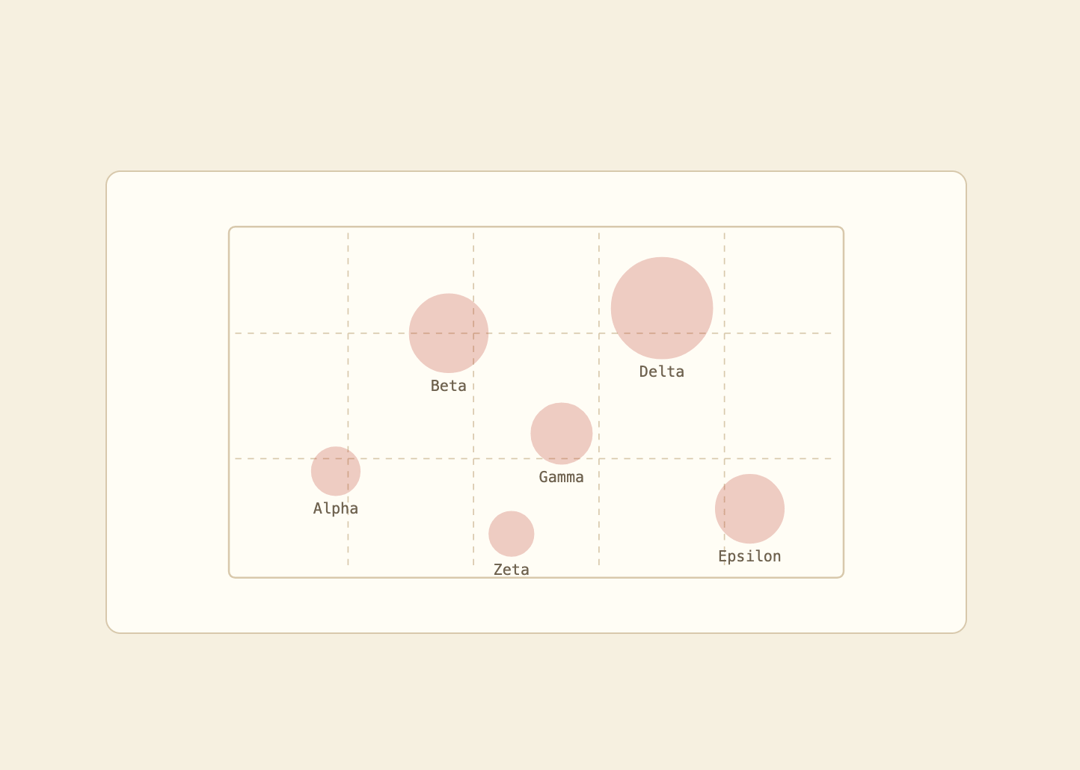
An SVG bubble chart that plots points on an x/y grid with circle size encoding a value and a hover state that highlights and labels each bubble.
Built with React and Tailwind. Copy the prompt and paste it into Claude Code, Cursor or Lovable: your agent adds Bubble Chart to your project and fits it to your theme.
Code
How Bubble Chart is used: the demo's code. The component's own source comes with a free account.
Usage.tsx
"use client";

import { BubbleChart, type BubblePoint } from "@/components/ui/bubble-chart";

const points: BubblePoint[] = [
  { id: "a", x: 18, y: 42, size: 18, label: "Alpha" },
  { id: "b", x: 36, y: 20, size: 42, label: "Beta" },
  { id: "c", x: 54, y: 36, size: 28, label: "Gamma" },
  { id: "d", x: 70, y: 16, size: 60, label: "Delta" },
  { id: "e", x: 84, y: 48, size: 34, label: "Epsilon" },
  { id: "f", x: 46, y: 52, size: 15, label: "Zeta" },
];

export default function BubbleChartDemo() {
  return (
    <div className="flex w-full items-center justify-center bg-[var(--background)] p-10">
      <div
        className="w-full max-w-xl rounded-lg border p-6"
        style={{ borderColor: "var(--border)", backgroundColor: "var(--card)" }}
      >
        <BubbleChart points={points} height={260} />
      </div>
    </div>
  );
}
More by f0rextasy
View all
Newsletter Signup Card
5
Board Checklist
3
Time Input
3
Running Order Timeline
2
Network Graph
2
Empty State Card
1
Invite Modal
1
Striped Progress Bar
1