
About
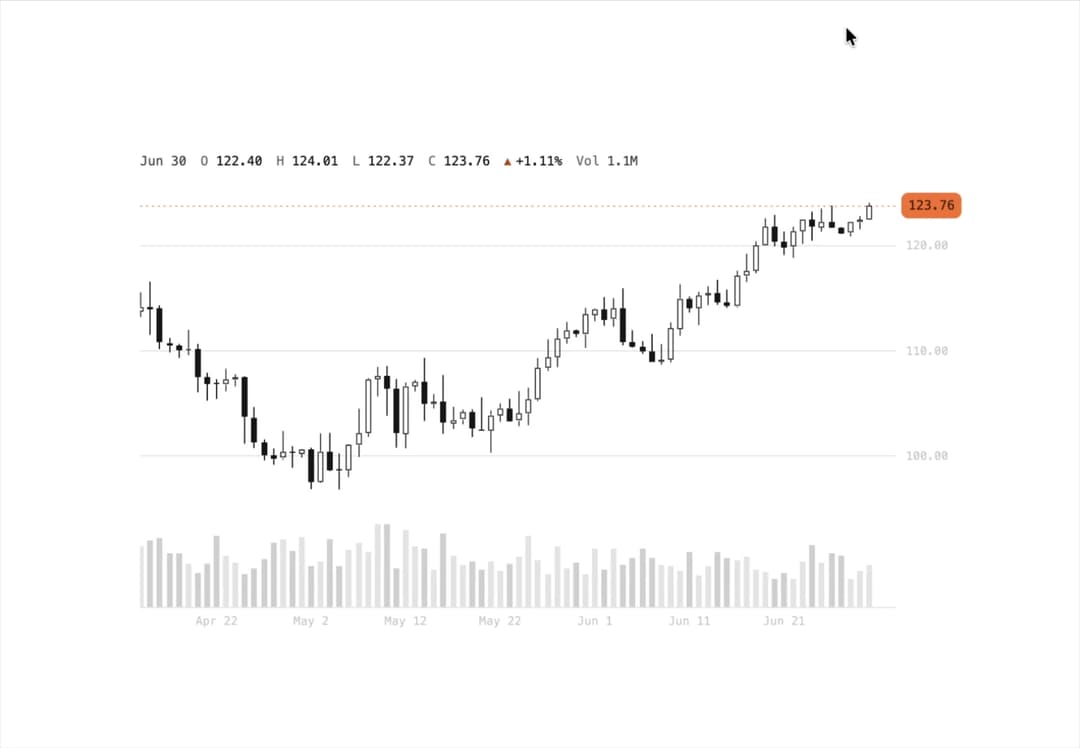
A canvas-rendered OHLC candlestick chart with pan, zoom, keyboard navigation, a live crosshair readout and an optional volume panel, for displaying financial price history.
Built with React and Tailwind. Copy the prompt and paste it into Claude Code, Cursor or Lovable: your agent adds Candlestick Chart to your project and fits it to your theme.
Code
How Candlestick Chart is used: the demo's code. The component's own source comes with a free account.
Usage.tsx
"use client";

import CandlestickChart, {
  createCandles,
} from "@/components/ui/candlestick-chart";

const data = createCandles(42, 180);

export default function CandlestickChartDemo() {
  return (
    <div className="w-full max-w-3xl p-6">
      <CandlestickChart data={data} height={420} />
    </div>
  );
}