
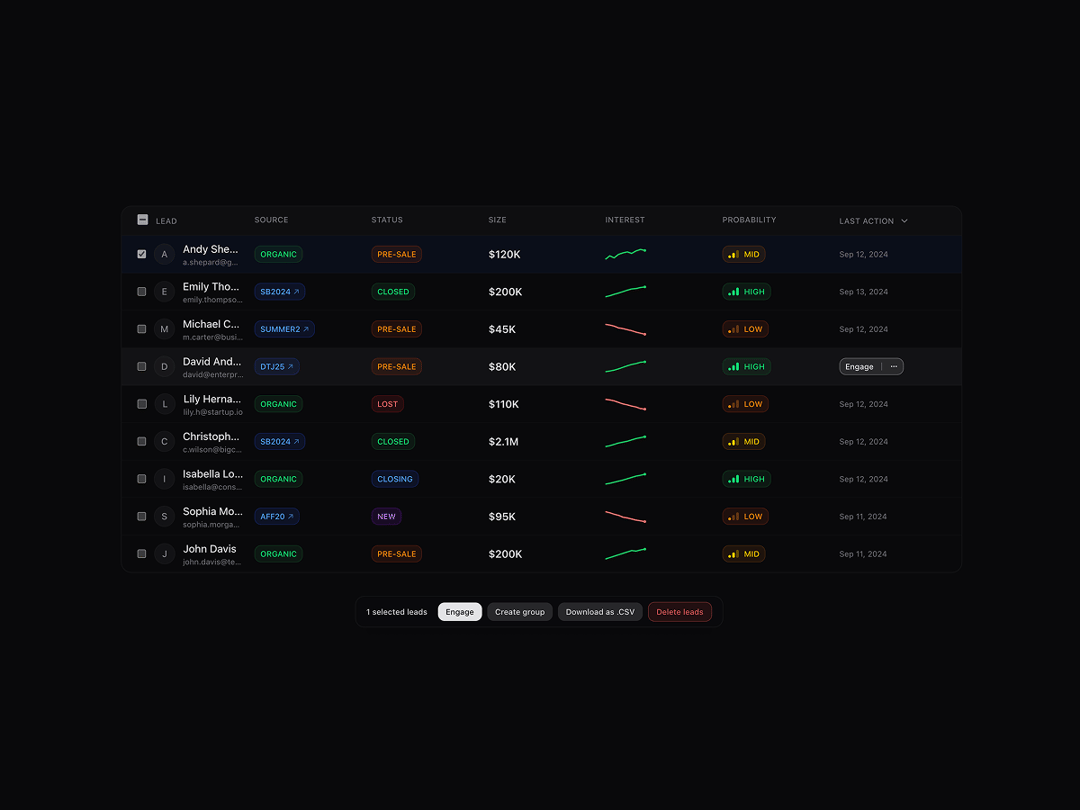
This leads table component displays sales prospects with comprehensive data visualization including deal sizes, source tracking, status indicators, interest trend sparklines, and probability scoring. It features smooth micro-interactions like hover-triggered action buttons, row selection with bulk operations, and a sliding bottom action bar that appears when leads are selected. The component is ideal for CRM dashboards, sales management interfaces, and lead tracking systems where users need to quickly assess and act on potential business opportunities.
Built with React and Tailwind. Copy the prompt and paste it into Claude Code, Cursor or Lovable: your agent adds Leads Data Table to your project and fits it to your theme.
Code
How Leads Data Table is used: the demo's code. The component's own source comes with a free account.
Usage.tsx
import { LeadsTable } from "@/components/ui/leads-data-table";

export default function DemoOne() {
  return <LeadsTable />;
}
Dependencies
More by Isaiah
View all
Agent Plan
2.2K
Voice Powered Orb
1.5K
Video Scroll Hero
1.4K
Reveal Text
1.1K
Portfolio Gallery
978
Message Dock
858
Ruler Carousel
661
Coach Scheduling Card
545
More in Dashboards
View all
Dashboard with Collapsible Sidebar
2.6K
Stat Card
36

Sidebar
388

SaaS Template
2.7K

Fitness Bento Grid
36
Stats Bento
1.2K

Glassy Dashboard
32

Course Design Cards
1.3K


