
About
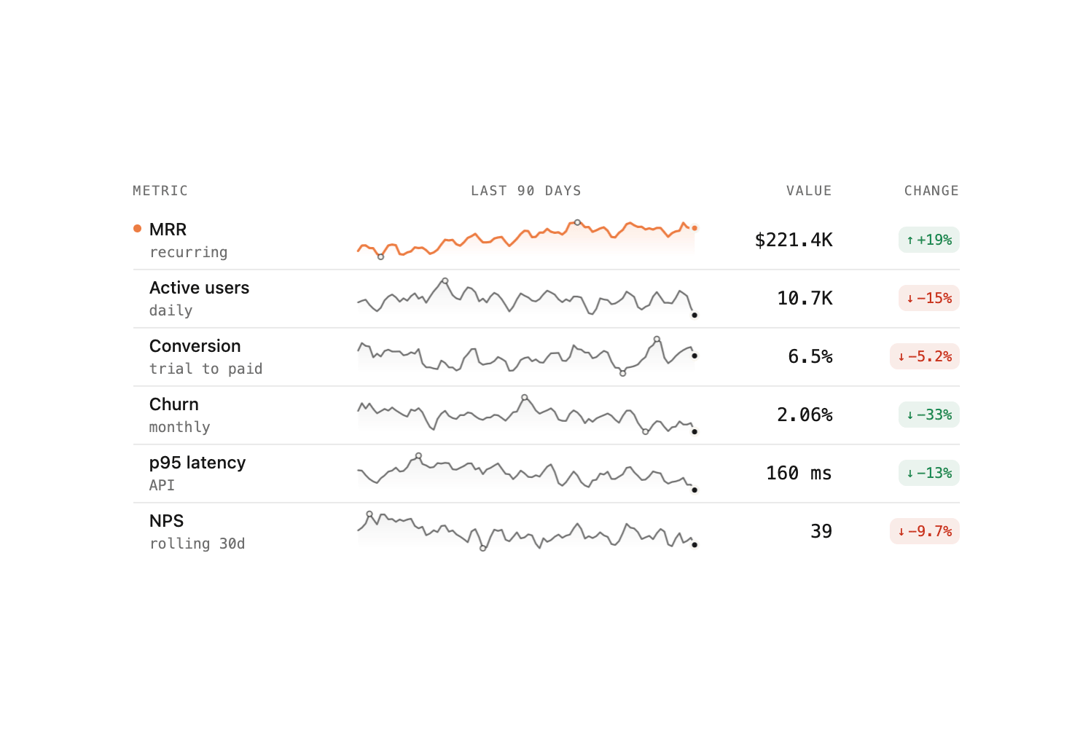
A metrics table where every row shows its own sparkline and all rows share one scrubbable crosshair, so dragging across any row rewinds every value to that day.
Built with React and Tailwind. Copy the prompt and paste it into Claude Code, Cursor or Lovable: your agent adds Spark Table to your project and fits it to your theme.
Code
How Spark Table is used: the demo's code. The component's own source comes with a free account.
Usage.tsx
"use client";

import SparkTable, { createMetricSeries } from "@/components/ui/spark-table";

const rows = [
  {
    id: "mrr",
    label: "MRR",
    sublabel: "recurring",
    data: createMetricSeries(1, 90, {
      base: 183100,
      trend: 0.214,
      weekly: 0.03,
      noise: 0.02,
    }),
    format: (v: number) => `$${(v / 1000).toFixed(1)}K`,
  },
  {
    id: "active-users",
    label: "Active users",
    sublabel: "daily",
    data: createMetricSeries(2, 90, {
      base: 12700,
      trend: -0.0157,
      weekly: 0.08,
      noise: 0.03,
    }),
    format: (v: number) => `${(v / 1000).toFixed(1)}K`,
  },
  {
    id: "conversion",
    label: "Conversion",
    sublabel: "trial to paid",
    data: createMetricSeries(3, 90, {
      base: 6.6,
      trend: 0.0303,
      weekly: 0.05,
      noise: 0.04,
    }),
    format: (v: number) => `${v.toFixed(1)}%`,
  },
  {
    id: "churn",
    label: "Churn",
    sublabel: "monthly",
    data: createMetricSeries(4, 90, {
      base: 3.08,
      trend: -0.2175,
      weekly: 0.06,
      noise: 0.05,
    }),
    format: (v: number) => `${v.toFixed(2)}%`,
    goodDirection: "down" as const,
  },
  {
    id: "p95-latency",
    label: "p95 latency",
    sublabel: "API",
    data: createMetricSeries(5, 90, {
      base: 183,
      trend: -0.0656,
      weekly: 0.03,
      noise: 0.02,
    }),
    format: (v: number) => `${v.toFixed(0)} ms`,
    goodDirection: "down" as const,
  },
  {
    id: "nps",
    label: "NPS",
    sublabel: "rolling 30d",
    data: createMetricSeries(6, 90, {
      base: 42,
      trend: 0.0238,
      weekly: 0.02,
      noise: 0.03,
    }),
    format: (v: number) => `${v.toFixed(0)}`,
  },
];

export default function SparkTableDemo() {
  return (
    <div className="w-full max-w-2xl mx-auto p-6">
      <SparkTable
        periodLabel="Last 90 days"
        rows={rows}
        ariaLabel="Business metrics"
      />
    </div>
  );
}
More by Isaiah
View all
Agent Plan
2.2K
Voice Powered Orb
1.5K
Video Scroll Hero
1.4K
Reveal Text
1.1K
Portfolio Gallery
968
Leads Data Table
955
Message Dock
849
Ruler Carousel
645
More in Dashboards
View all
Dashboard with Collapsible Sidebar
2.6K

Sidebar
351

SaaS Template
2.6K
Stats Bento
1.2K
Stats cards with links
129

Course Design Cards
1.2K

Chat template
646

Statistics Card 2
293


