

About
A diverging dot-matrix chart of sectors gaining and losing each month: dots stack above or below a zero line, coloured by % change. Follow one sector across time, filter by the legend, read months with the keyboard. Pass your own data.
Built with React and Tailwind. Copy the prompt and paste it into Claude Code, Cursor or Lovable: your agent adds Sector Tide Matrix to your project and fits it to your theme.
Code
How Sector Tide Matrix is used: the demo's code. The component's own source comes with a free account.
Usage.tsx
import SectorTideMatrix from "@/components/ui/sector-tide-matrix"

export default function SectorTideMatrixDemo() {
  return <SectorTideMatrix />
}
More by Kedhareswer Naidu
View all

Glassmorphism Folder Cards
5.2K
Halftone Wordmark Footer
2.2K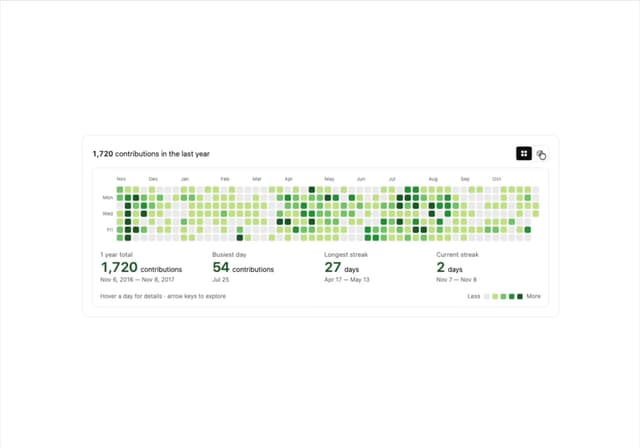
GitHub Contribution Graph 3D Heatmap
2.1K
Morph Gallery
1.9K
Food Menu Scroll Carousel
1.6K
Animated Features Bento with Live Diagrams
1.3K
Hanging Polaroid Image Carousel
1.2K
Flipping Website Screenshot Deck
893
More in Dashboards
View all
Dashboard with Collapsible Sidebar
2.6K
Stat Card
46

Sidebar
392

Chart Component
11

SaaS Template
2.7K

Fitness Bento Grid
42

Financial Bento Grid
129

Course Design Cards
1.3K

