
About
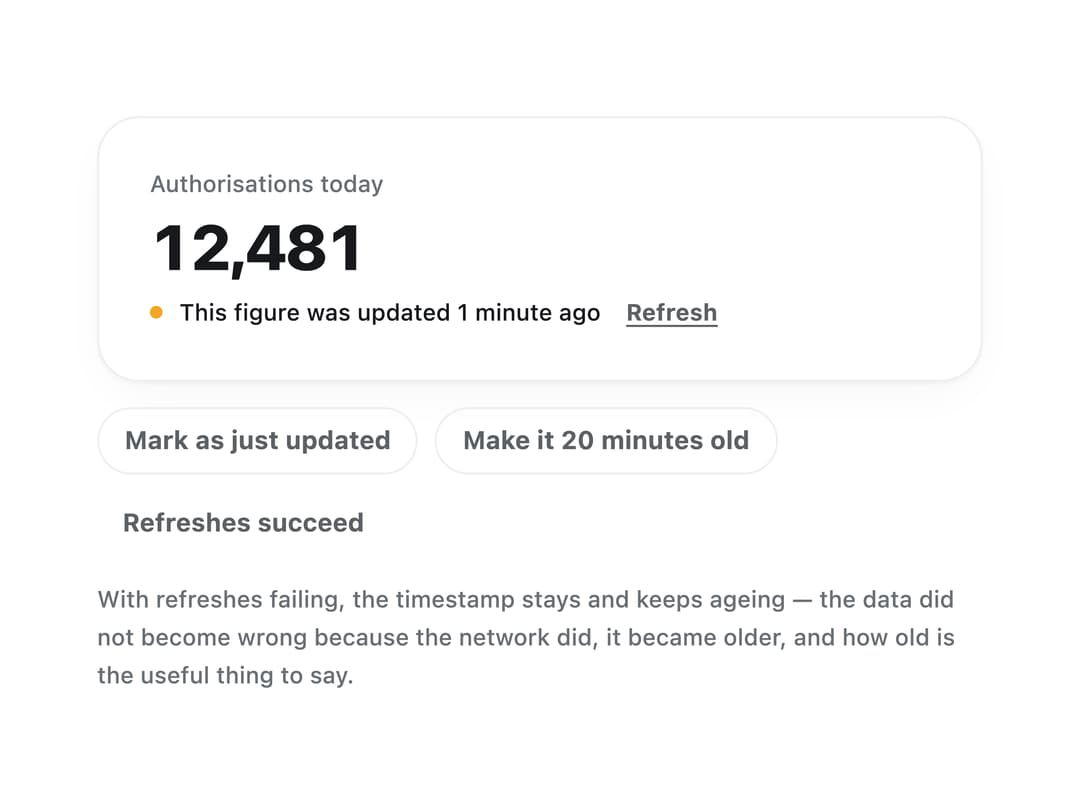
A status line that shows how long ago a figure or dataset was fetched, flags it as stale past a caller-set threshold, and offers a refresh action.
Built with React and Tailwind. Copy the prompt and paste it into Claude Code, Cursor or Lovable: your agent adds Data Freshness to your project and fits it to your theme.
Code
How Data Freshness is used: the demo's code. The component's own source comes with a free account.
Usage.tsx
"use client";

import * as React from "react";
import DataFreshness from "@/components/ui/data-freshness";

function FreshnessExample() {
  const [updatedAt, setUpdatedAt] = React.useState(
    () => new Date(Date.now() - 90_000),
  );
  const [loading, setLoading] = React.useState(false);
  const [failed, setFailed] = React.useState(false);

  const refresh = async () => {
    setLoading(true);
    await new Promise((resolve) => window.setTimeout(resolve, 800));
    setLoading(false);
    if (failed) return;
    setUpdatedAt(new Date());
  };

  return (
    <div className="flex w-full max-w-[420px] flex-col gap-3">
      <div className="flex flex-col items-start gap-2 rounded-[var(--radius-card)] border border-line bg-surface p-6 shadow-[var(--shadow-card)]">
        <p className="text-[11px] font-medium leading-tight text-ink-faint">
          Authorisations today
        </p>
        <p className="text-[30px] font-extrabold leading-none tracking-[-0.035em] text-ink tabular-nums">
          12,481
        </p>
        <DataFreshness
          updatedAt={updatedAt}
          staleAfter={60_000}
          loading={loading}
          error={failed ? "The last refresh failed." : undefined}
          onRefresh={() => void refresh()}
          label="This figure"
        />
      </div>

      <div className="flex flex-wrap gap-2">
        <button
          type="button"
          onClick={() => setUpdatedAt(new Date())}
          className="rounded-full border border-line px-3 py-1.5 text-[12px] font-bold text-ink-soft transition-colors hover:text-ink"
        >
          Mark as just updated
        </button>
        <button
          type="button"
          onClick={() => setUpdatedAt(new Date(Date.now() - 20 * 60_000))}
          className="rounded-full border border-line px-3 py-1.5 text-[12px] font-bold text-ink-soft transition-colors hover:text-ink"
        >
          Make it 20 minutes old
        </button>
        <button
          type="button"
          onClick={() => setFailed((value) => !value)}
          className={
            failed
              ? "rounded-full bg-accent px-3 py-1.5 text-[12px] font-bold text-accent-ink"
              : "rounded-full px-3 py-1.5 text-[12px] font-bold text-ink-soft transition-colors hover:text-ink"
          }
        >
          {failed ? "Refreshes fail" : "Refreshes succeed"}
        </button>
      </div>

      <p className="max-w-[68ch] text-[11px] font-medium leading-relaxed text-ink-faint">
        With refreshes failing, the timestamp stays and keeps ageing — the data
        did not become wrong because the network did, it became older, and how
        old is the useful thing to say.
      </p>
    </div>
  );
}

export default function DataFreshnessDemo() {
  return <FreshnessExample />;
}
More by klyv-ui
View all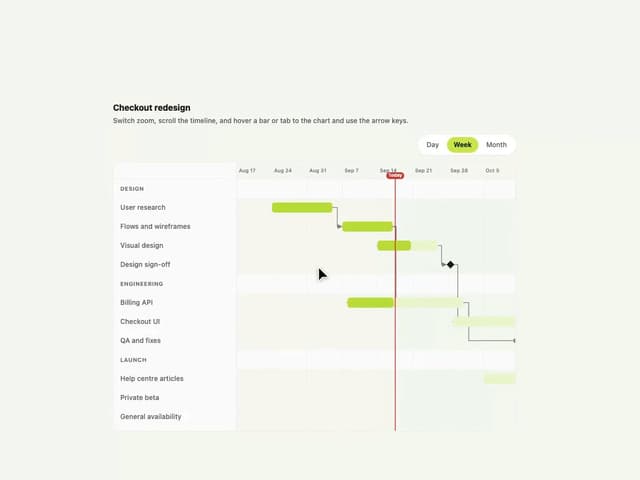
Gantt Chart
68
Klyv Animated Beam
55
Shader Canvas
54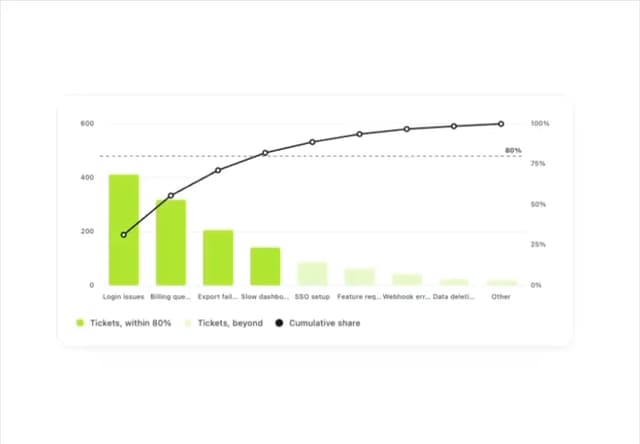
Pareto Chart
49
Sunburst Chart
28
Gooey Loader
26
Fluid Canvas
26
Morphing Text
23
More in Dashboards
View all
Dashboard with Collapsible Sidebar
2.5K

Sidebar
311

SaaS Template
2.5K
Stats Bento
1.1K

Course Design Cards
1.2K

Invoice History Table
81

Data Grid Table
11

Bar Chart
17

