
About
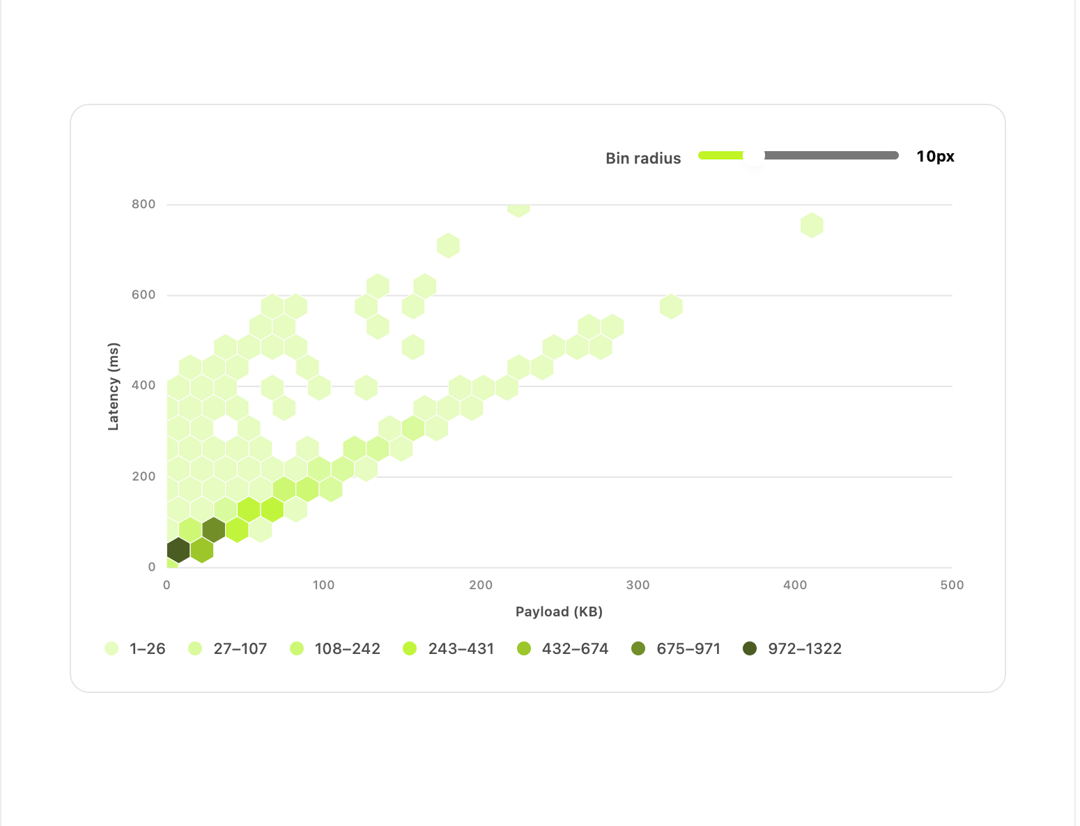
A hexagonal-binning scatter chart that groups thousands of (x, y) points into coloured hexagons by density, with a radius control, keyboard-navigable tooltips and an accessible summary.
Built with React and Tailwind. Copy the prompt and paste it into Claude Code, Cursor or Lovable: your agent adds Hexbin Chart to your project and fits it to your theme.
Code
How Hexbin Chart is used: the demo's code. The component's own source comes with a free account.
Usage.tsx
"use client";

import { HexbinChart } from "@/components/ui/hexbin-chart";

/** Deterministic synthetic data: request payload size (KB) against latency (ms),
 *  skewed so most requests are small and fast with a slow, heavy tail — the
 *  shape a hexbin chart is built to summarise honestly at scale. */
function generatePoints(count: number) {
  let seed = 42;
  const rand = () => {
    seed = (seed * 9301 + 49297) % 233280;
    return seed / 233280;
  };
  const points: { x: number; y: number }[] = [];
  for (let i = 0; i < count; i++) {
    const payload = Math.max(0.2, -40 * Math.log(1 - rand()));
    const tail = rand() < 0.03 ? rand() * 420 : 0;
    const latency = Math.max(
      1,
      20 + payload * 1.8 + (rand() - 0.5) * 30 + tail,
    );
    points.push({ x: payload, y: latency });
  }
  return points;
}

const points = generatePoints(5000);

export default function HexbinChartDemo() {
  return (
    <div className="w-full max-w-2xl rounded-xl border border-border bg-background p-6 text-foreground">
      <HexbinChart
        points={points}
        label="Request size against latency"
        xLabel="Payload (KB)"
        yLabel="Latency (ms)"
        colorScale="sqrt"
      />
    </div>
  );
}
More by klyv-ui
View all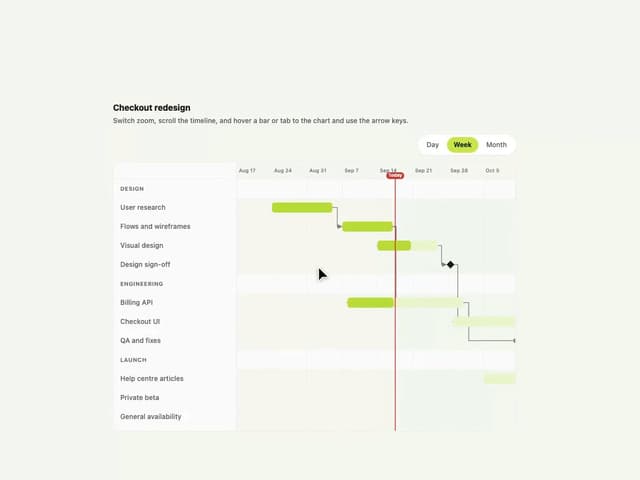
Gantt Chart
97
Shader Canvas
63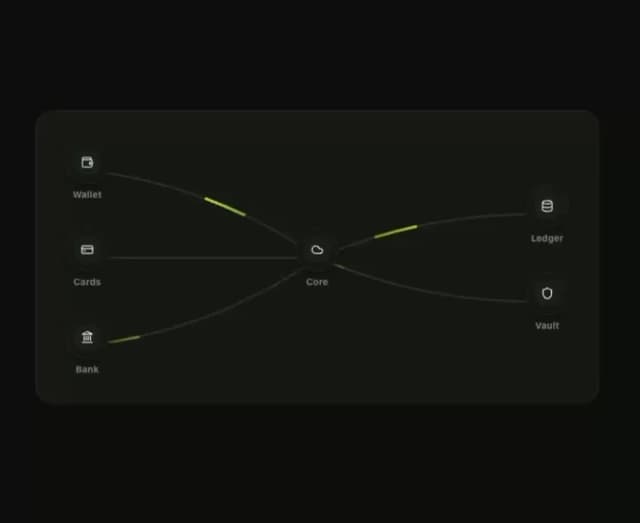
Klyv Animated Beam
61
Pareto Chart
58
Fluid Canvas
42
Sunburst Chart
34
Morphing Text
30
Gooey Loader
29