
About
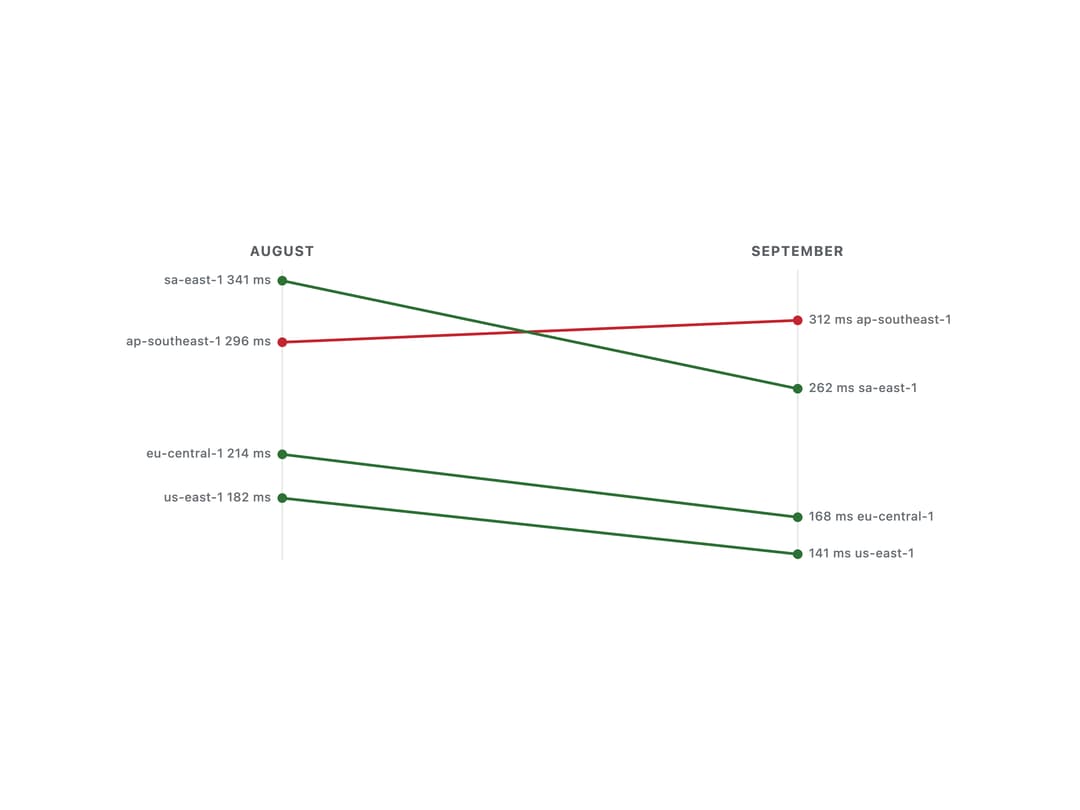
An accessible SVG chart that shows how a value changed between two moments for several items at once, with one line per item sloping from its start value to its end value.
Built with React and Tailwind. Copy the prompt and paste it into Claude Code, Cursor or Lovable: your agent adds Slope Chart to your project and fits it to your theme.
Code
How Slope Chart is used: the demo's code. The component's own source comes with a free account.
Usage.tsx
"use client";

import SlopeChart from "@/components/ui/slope-chart";

const LATENCY = [
  { id: "iad", label: "us-east-1", start: 182, end: 141 },
  { id: "fra", label: "eu-central-1", start: 214, end: 168 },
  { id: "sin", label: "ap-southeast-1", start: 296, end: 312 },
  { id: "gru", label: "sa-east-1", start: 341, end: 262 },
];

export default function SlopeChartLowerIsBetterDemo() {
  return (
    <div className="flex w-full max-w-xl items-center justify-center p-8">
      <SlopeChart
        items={LATENCY}
        startLabel="August"
        endLabel="September"
        higherIsBetter={false}
        height={240}
        format={(value) => `${Math.round(value)} ms`}
        label="p95 latency by region, August against September"
      />
    </div>
  );
}
More by klyv-ui
View all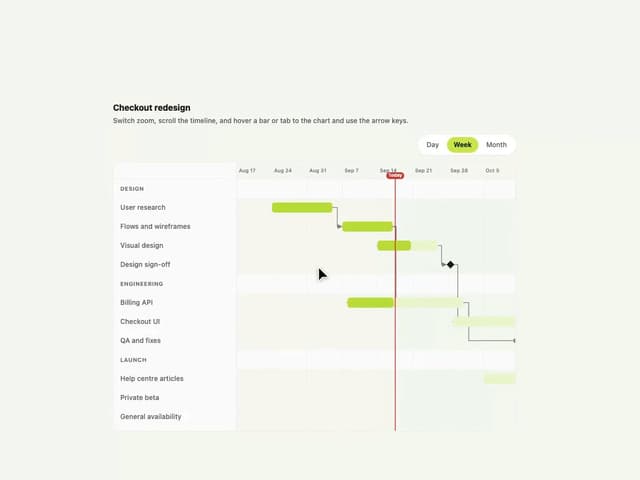
Gantt Chart
68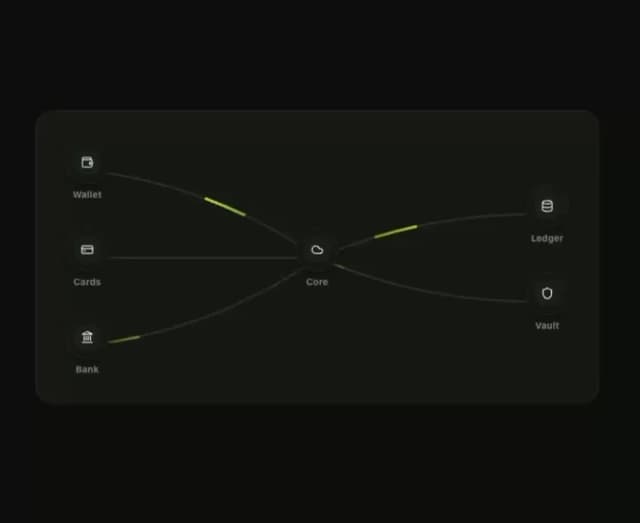
Klyv Animated Beam
56
Shader Canvas
54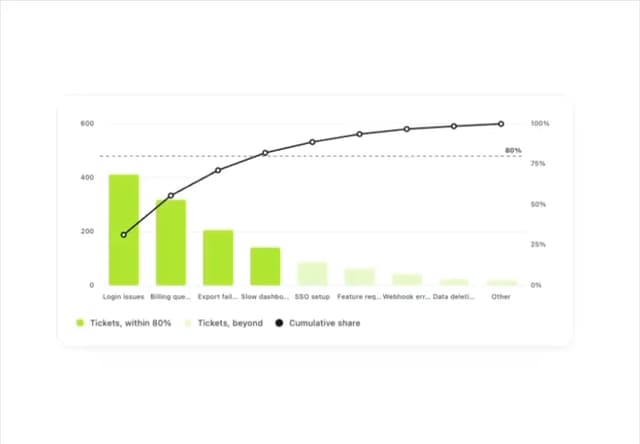
Pareto Chart
49
Fluid Canvas
29
Sunburst Chart
28
Gooey Loader
26
Morphing Text
23