
About
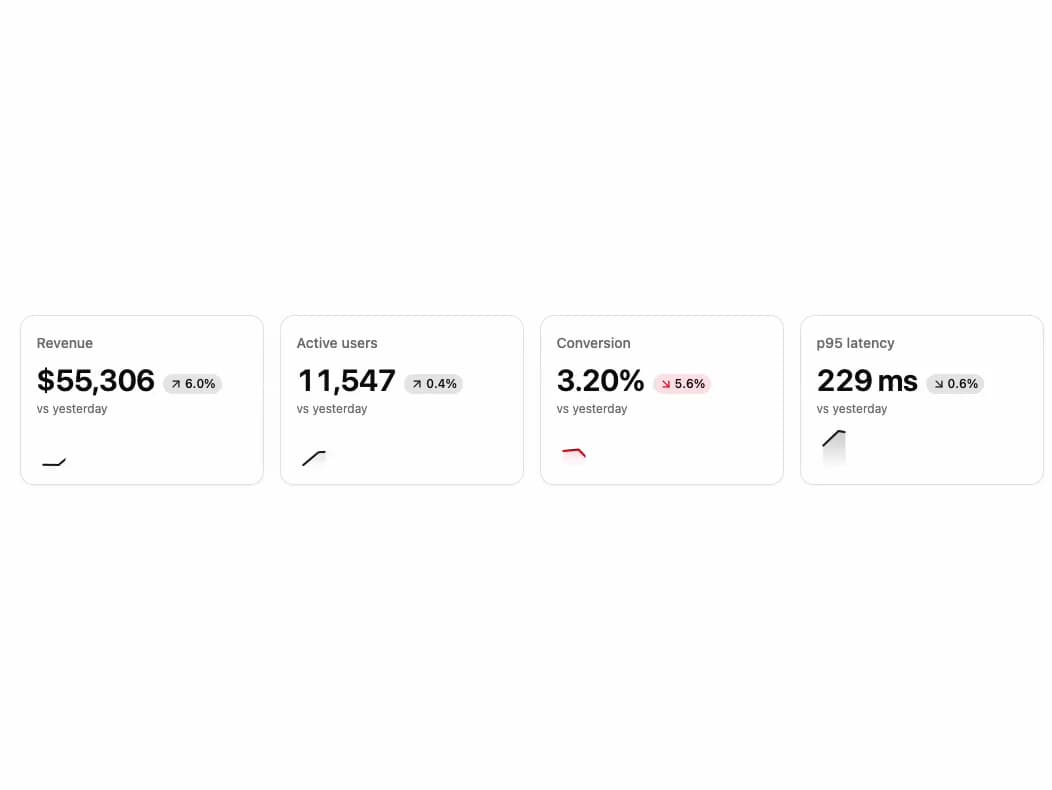
Compact KPI tile: a value that rolls to each new number, its change with an arrow that turns, and an SVG sparkline that draws in, morphs as data arrives and shows any day's value under the pointer or the arrow keys. Loading and empty states.
Built with React and Tailwind. Copy the prompt and paste it into Claude Code, Cursor or Lovable: your agent adds KPI Tile to your project and fits it to your theme.
Code
How KPI Tile is used: the demo's code. The component's own source comes with a free account.
Usage.tsx
"use client";

import { useEffect, useState } from "react";
import { KpiTile } from "@/components/ui/kpi-tile";

const settings = {
  /** Days in each sparkline, 2 to 30. */
  days: 14,
  /** Tiles with no data yet. */
  empty: false,
  /** A new day every two seconds. */
  live: true,
  /** Skeletons, as while the first numbers load. */
  loading: false,
};

const DAY_MS = 86_400_000;
/** The slow trend is a long wave, so a demo left running never drifts out of range. */
const TREND_DAYS = 60;
const FIRST_DAY = Date.UTC(2026, 9, 1);
const TICK_MS = 2000;
const DAY_NAME = new Intl.DateTimeFormat("en-US", {
  day: "numeric",
  month: "short",
  timeZone: "UTC",
});

type Metric = {
  label: string;
  base: number;
  /** Growth per day, and how far a day wobbles around it. */
  growth: number;
  swing: number;
  phase: number;
  format: (value: number) => string;
  lowerIsBetter?: boolean;
};

const whole = new Intl.NumberFormat("en-US", { maximumFractionDigits: 0 });
const METRICS: Metric[] = [
  {
    base: 41_800,
    format: (value) => `$${whole.format(value)}`,
    growth: 0.011,
    label: "Revenue",
    phase: 0,
    swing: 0.05,
  },
  {
    base: 9640,
    format: (value) => whole.format(value),
    growth: 0.006,
    label: "Active users",
    phase: 1.6,
    swing: 0.03,
  },
  {
    base: 3.1,
    format: (value) => `${value.toFixed(2)}%`,
    growth: 0.003,
    label: "Conversion",
    phase: 3,
    swing: 0.07,
  },
  {
    base: 248,
    format: (value) => `${Math.round(value)} ms`,
    growth: -0.004,
    label: "p95 latency",
    lowerIsBetter: true,
    phase: 1.6,
    swing: 0.06,
  },
];

/** The same story on every visit: a slow trend with a repeatable wobble of two sines. */
const valueOn = (metric: Metric, day: number) =>
  metric.base *
  (1 + metric.growth * TREND_DAYS * Math.sin(day / TREND_DAYS)) *
  (1 +
    metric.swing *
      (Math.sin(day * 1.7 + metric.phase) * 0.6 +
        Math.sin(day * 0.6 + metric.phase * 2) * 0.4));

/** Four live KPIs: three that should grow, and a latency where lower is better. */
export default function Demo(props: Partial<typeof settings>) {
  const { days, empty, live, loading } = { ...settings, ...props };
  const count = Number.isFinite(days)
    ? Math.min(Math.max(Math.round(days), 2), 30)
    : 14;
  const [today, setToday] = useState(30);

  useEffect(() => {
    if (!live) {
      return;
    }
    const timer = window.setInterval(() => setToday((day) => day + 1), TICK_MS);
    return () => window.clearInterval(timer);
  }, [live]);

  const inView = Array.from(
    { length: count },
    (_, index) => today - count + 1 + index
  );
  const labels = inView.map((day) => DAY_NAME.format(FIRST_DAY + day * DAY_MS));

  return (
    <div className="flex min-h-[360px] w-full items-center justify-center bg-background p-4 sm:p-8">
      <div className="grid w-full max-w-5xl gap-4 sm:grid-cols-2 lg:grid-cols-4">
        {METRICS.map((metric) => {
          const trend = inView.map((day) => valueOn(metric, day));
          const now = trend.at(-1) ?? 0;
          const before = trend.at(-2) ?? now;
          return (
            <KpiTile
              delta={empty ? undefined : ((now - before) / before) * 100}
              deltaLabel="vs yesterday"
              format={metric.format}
              key={metric.label}
              label={metric.label}
              live={live}
              loading={loading}
              lowerIsBetter={metric.lowerIsBetter}
              trend={empty ? [] : trend}
              trendLabels={labels}
              value={empty ? undefined : now}
            />
          );
        })}
      </div>
    </div>
  );
}
Dependencies
More by OSAGI
View all
AI Orb
152
OTP Input
18
Reasoning Thread
12
Assistant Composer
8
Stat Card
1
Release Notes
Docs TOC
Docs Search
More in Dashboards
View all
Dashboard with Collapsible Sidebar
2.6K

Sidebar
347

SaaS Template
2.6K
Stats Bento
1.2K

Course Design Cards
1.2K
Stats cards with links
40

Card
237

Financial Bento Grid
105


