
About
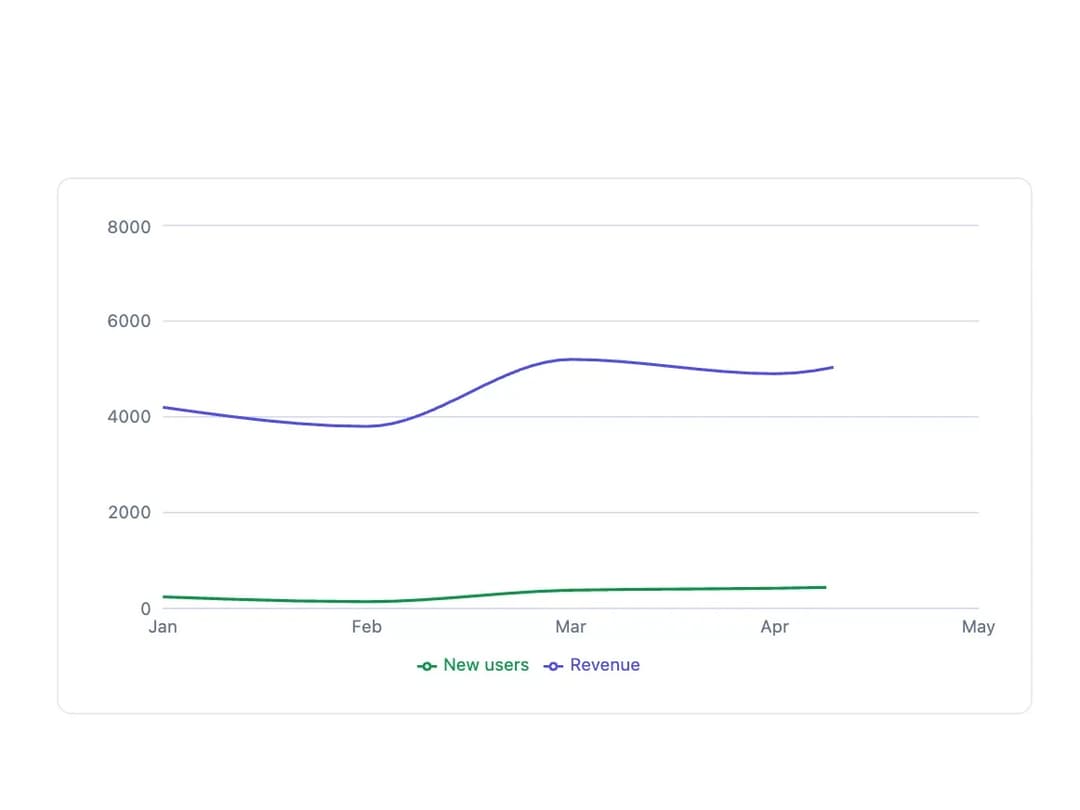
A token-themed line, bar, and area chart for dashboards built on recharts, with a design-system-driven color palette and tooltip.
Built with React and Tailwind. Copy the prompt and paste it into Claude Code, Cursor or Lovable: your agent adds Chart to your project and fits it to your theme.
Code
How Chart is used: the demo's code. The component's own source comes with a free account.
Usage.tsx
import { LineChart } from "@/components/ui/chart";

export default function ChartDemo() {
  return (
    <div className="w-full max-w-2xl rounded-lg border border-border bg-background p-6">
      <LineChart
        data={[
          { month: "Jan", revenue: 4200, users: 240 },
          { month: "Feb", revenue: 3800, users: 139 },
          { month: "Mar", revenue: 5200, users: 380 },
          { month: "Apr", revenue: 4900, users: 420 },
          { month: "May", revenue: 6100, users: 510 },
        ]}
        xKey="month"
        series={[
          { key: "revenue", label: "Revenue" },
          { key: "users", label: "New users" },
        ]}
      />
    </div>
  );
}