
About
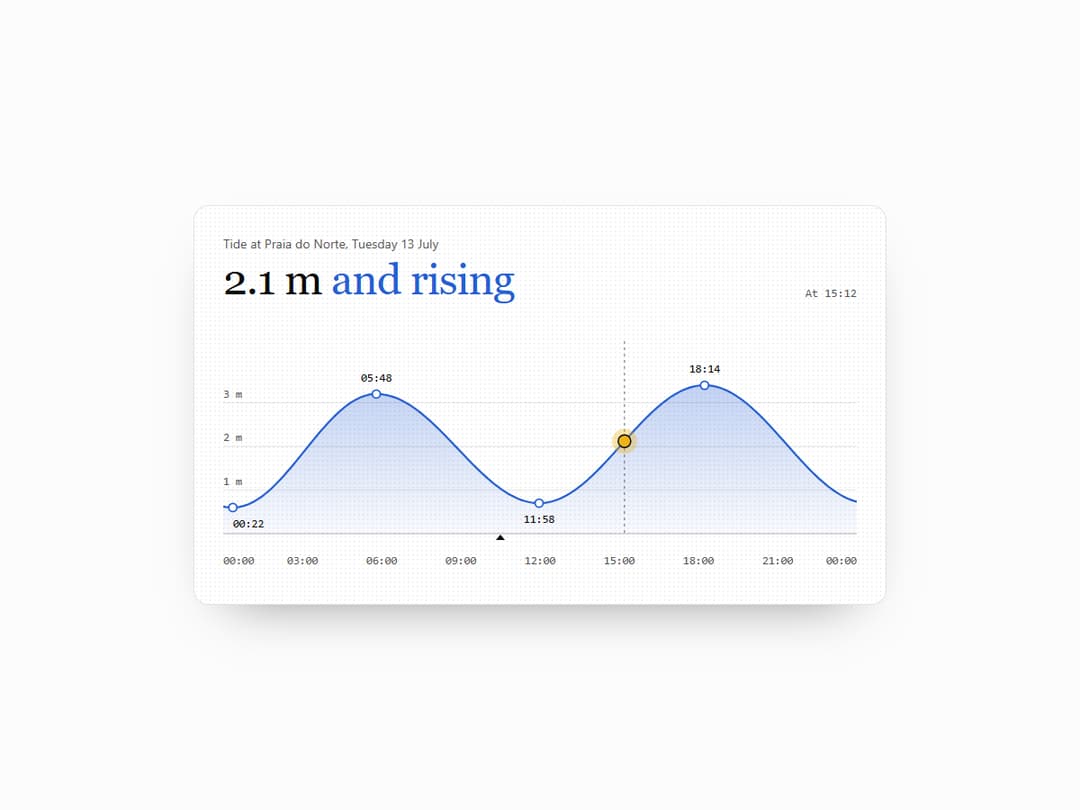
Interactive tide chart card. Highs and lows on a smooth curve, a sun marker you scrub by pointer or keyboard, and a live readout of height and trend. Theme tokens, light and dark.
Built with React and Tailwind. Copy the prompt and paste it into Claude Code, Cursor or Lovable: your agent adds Tide Chart to your project and fits it to your theme.
Code
How Tide Chart is used: the demo's code. The component's own source comes with a free account.
Usage.tsx
import TideChart from "@/components/ui/tide-chart";

export default function TideChartDemo() {
  return (
    <div className="flex min-h-[640px] items-center justify-center bg-background px-4 py-16 sm:px-8">
      <TideChart
        className="max-w-3xl"
        label="Tide at Praia do Norte, Tuesday 13 July"
        now="10:30"
        unit="m"
        extremes={[
          { time: "00:22", height: 0.6 },
          { time: "05:48", height: 3.2 },
          { time: "11:58", height: 0.7 },
          { time: "18:14", height: 3.4 },
        ]}
      />
    </div>
  );
}
Dependencies
More by onepaste
View all

Sun Arc
Liquid Jar