
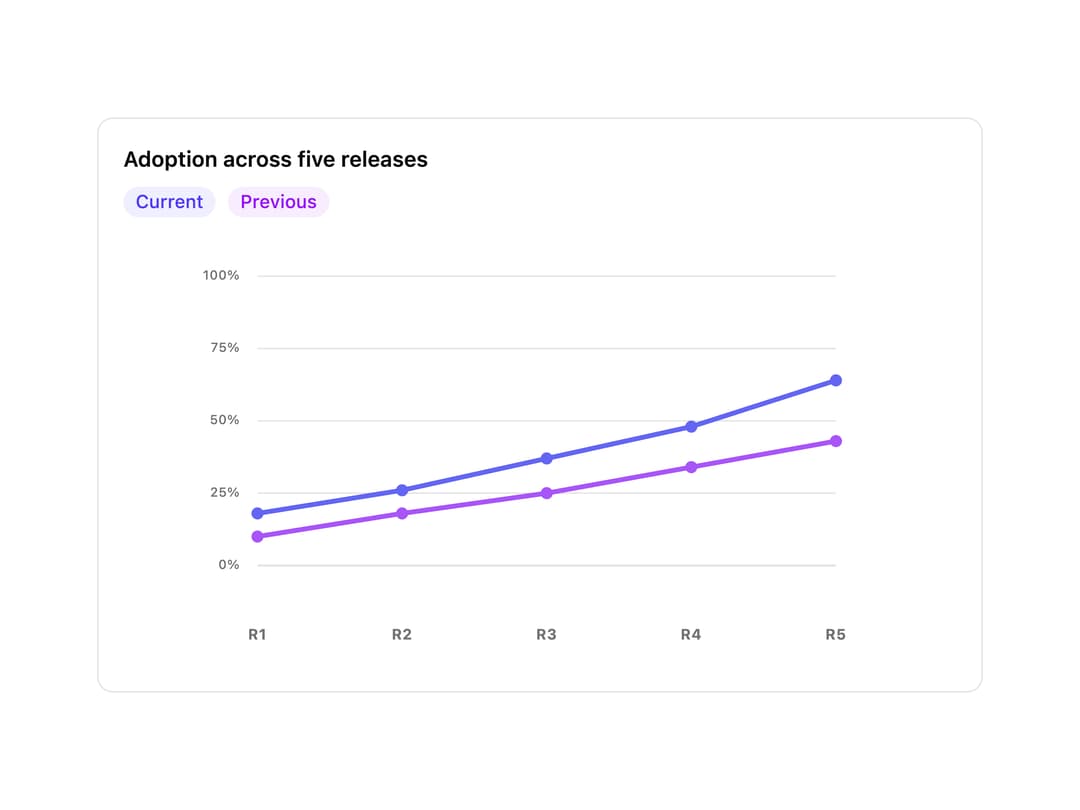
About
An animated SVG line chart for comparing one or more labeled data series over equally spaced categories, with optional area fill, point markers, value labels and a grid/zero axis.
Built with React and Tailwind. Copy the prompt and paste it into Claude Code, Cursor or Lovable: your agent adds Line Chart to your project and fits it to your theme.
Code
How Line Chart is used: the demo's code. The component's own source comes with a free account.
Usage.tsx
import LineChart from "@/components/ui/line-chart";

export default function LineChartDemo() {
  return (
    <div className="w-full max-w-xl rounded-lg border border-border bg-card p-4">
      <h3 className="mb-2 text-sm font-semibold text-foreground">
        Adoption across five releases
      </h3>
      <div className="mb-3 flex gap-2 text-xs">
        <span className="rounded-full bg-indigo-500/10 px-2 py-0.5 font-medium text-indigo-600">
          Current
        </span>
        <span className="rounded-full bg-purple-500/10 px-2 py-0.5 font-medium text-purple-600">
          Previous
        </span>
      </div>
      <LineChart
        title="Adoption by release"
        ariaLabel="R1 to R5: Current 18, 26, 37, 48, 64 percent; Previous 10, 18, 25, 34, 43 percent"
        series={[
          {
            label: "Current",
            points: [
              { label: "R1", value: 18 },
              { label: "R2", value: 26 },
              { label: "R3", value: 37 },
              { label: "R4", value: 48 },
              { label: "R5", value: 64 },
            ],
          },
          {
            label: "Previous",
            points: [
              { label: "R1", value: 10 },
              { label: "R2", value: 18 },
              { label: "R3", value: 25 },
              { label: "R4", value: 34 },
              { label: "R5", value: 43 },
            ],
          },
        ]}
        minValue={0}
        maxValue={100}
        valueSuffix="%"
        height={280}
        curve="linear"
      />
    </div>
  );
}
More by purestackstudio
View all
Drop Files