import { useEffect } from "react"
import { Activity, Target, Timer } from "lucide-react"
import KpiCardRow from "@/components/ui/kpi-card-row"
import type { KpiMetric, KpiRange, KpiSeries } from "@/components/ui/kpi-card-row"

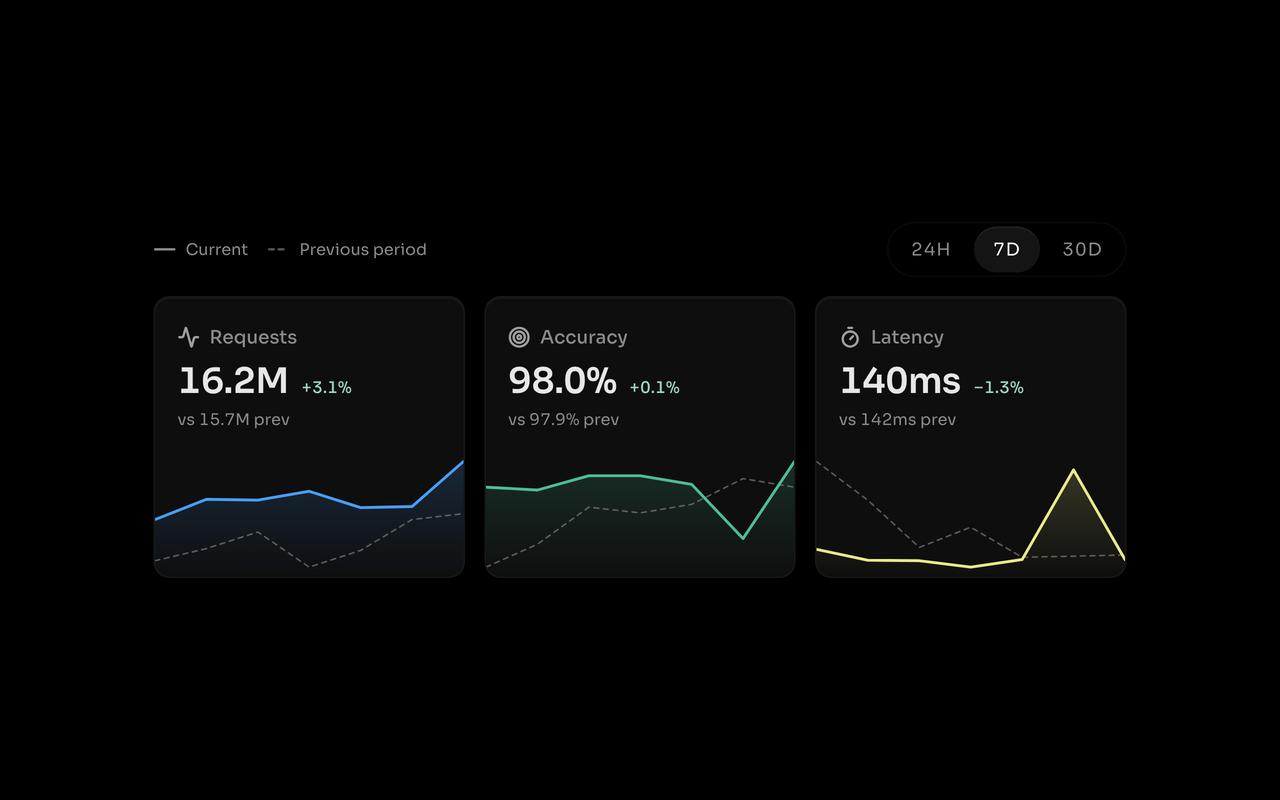
/* Sixty days of hourly telemetry for an inference API, generated once from a fixed seed
   (no Math.random), then rolled up per range: 24H = 24 hourly points, 7D = 7 daily points,
   30D = 30 daily points. Each range also carries the window before it. Latency is the hourly
   p95; an incident around day 40 lifts its 30-day mean. */

function seeded(seed: number) {
  return () => {
    seed = (seed + 0x6d2b79f5) | 0
    let t = Math.imul(seed ^ (seed >>> 15), 1 | seed)
    t = (t + Math.imul(t ^ (t >>> 7), 61 | t)) ^ t
    return ((t ^ (t >>> 14)) >>> 0) / 4294967296
  }
}

const HOURS = 60 * 24
const END = Date.UTC(2026, 8, 26, 12)
const rand = seeded(2126)
const bump = (day: number, at: number, width: number) => Math.exp(-(((day - at) / width) ** 2))

const time: number[] = []
const requests: number[] = []
const accuracy: number[] = []
const latency: number[] = []

for (let i = 0; i < HOURS; i++) {
  const t = END - (HOURS - 1 - i) * 36e5
  const day = i / 24
  const load = 0.5 - 0.5 * Math.cos(((new Date(t).getUTCHours() - 3) / 24) * 2 * Math.PI)
  const incident = bump(day, 40, 4.5)
  time.push(t)
  requests.push(Math.round(84000 * (0.7 + 0.45 * load) * (1 + 0.0042 * day) * (1 + (rand() - 0.5) * 0.14)))
  accuracy.push(Math.round((97.62 + 0.009 * day - 1.6 * incident - 0.35 * bump(day, 58.5, 0.45) - 0.25 * load + (rand() - 0.5) * 0.5) * 100) / 100)
  latency.push(Math.round(131 + 20 * load + 82 * incident + 15 * bump(day, 58.5, 0.45) - 0.1 * Math.max(0, day - 30) + (rand() - 0.5) * 16))
}

const WINDOWS = { "24h": [24, 1], "7d": [168, 24], "30d": [720, 24] } as const

function rollup(values: number[], size: number, how: "sum" | "avg") {
  const out: number[] = []
  for (let i = 0; i < values.length; i += size) {
    const chunk = values.slice(i, i + size)
    const sum = chunk.reduce((a, b) => a + b, 0)
    out.push(how === "sum" ? sum : Math.round((sum / chunk.length) * 100) / 100)
  }
  return out
}

function byRange(values: number[], how: "sum" | "avg") {
  const out: Record<string, KpiSeries> = {}
  for (const [key, [span, size]] of Object.entries(WINDOWS)) {
    out[key] = {
      current: rollup(values.slice(-span), size, how),
      previous: rollup(values.slice(-2 * span, -span), size, how),
      timestamps: time.slice(-span).filter((_, i) => i % size === 0),
    }
  }
  return out
}

const compact = new Intl.NumberFormat("en-US", { notation: "compact", maximumSignificantDigits: 3 })

const ranges: KpiRange[] = [
  { value: "24h", label: "24H" },
  { value: "7d", label: "7D" },
  { value: "30d", label: "30D" },
]

const metrics: KpiMetric[] = [
  {
    id: "requests",
    label: "Requests",
    icon: <Activity />,
    color: "var(--chart-1)",
    aggregate: "sum",
    format: (v) => compact.format(v),
    series: byRange(requests, "sum"),
  },
  {
    id: "accuracy",
    label: "Accuracy",
    icon: <Target />,
    color: "var(--chart-2)",
    aggregate: "avg",
    format: (v) => `${v.toFixed(1)}%`,
    series: byRange(accuracy, "avg"),
  },
  {
    id: "latency",
    label: "Latency",
    icon: <Timer />,
    color: "var(--chart-4)",
    aggregate: "avg",
    format: (v) => `${Math.round(v)}ms`,
    lowerIsBetter: true,
    series: byRange(latency, "avg"),
  },
]

export default function DemoOne() {
  // open the preview in dark by default; the sandbox theme toggle still works
  useEffect(() => { document.documentElement.classList.add("dark") }, [])
  return (
    <div className="mx-auto w-full max-w-2xl p-4">
      <KpiCardRow metrics={metrics} ranges={ranges} defaultRange="7d" />
    </div>
  )
}