
About
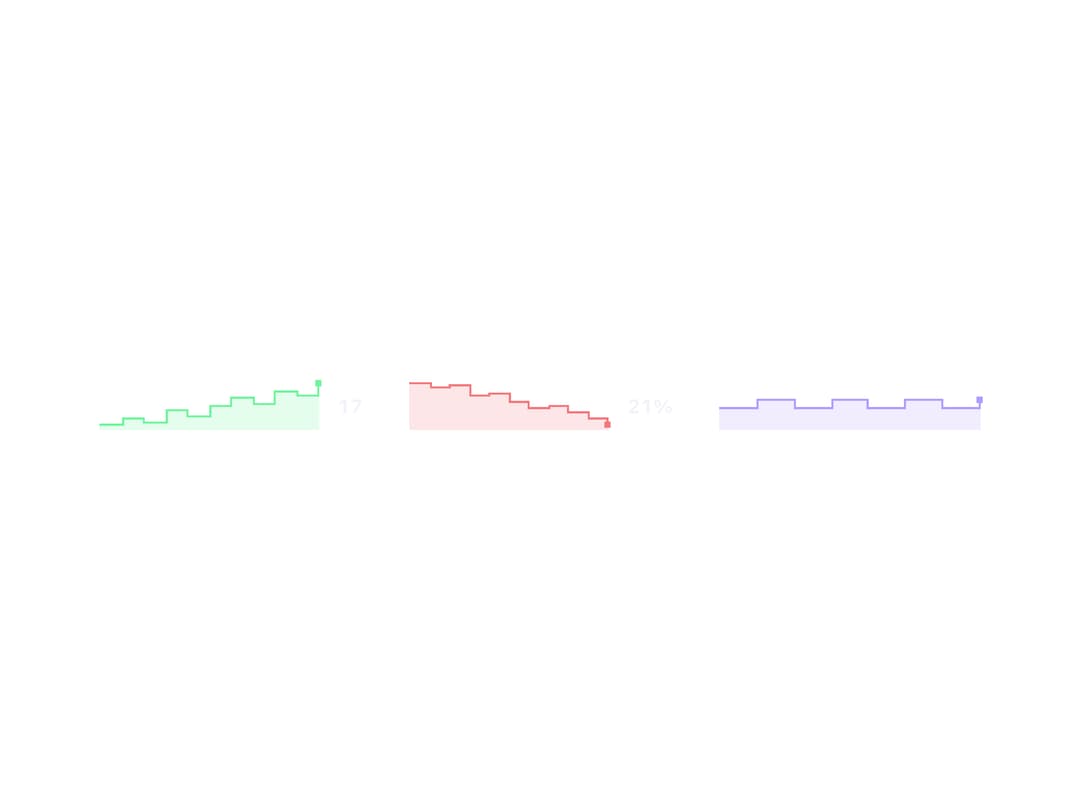
A tiny inline canvas chart that draws a stepped trend line with a soft area fill, built to sit next to a metric and grow as new values are pushed into it. Ported to React (MIT) from the sb-sparkline web component in zweiundeins' Starbase library — credit to the original author.
Built with React and Tailwind. Copy the prompt and paste it into Claude Code, Cursor or Lovable: your agent adds Sparkline to your project and fits it to your theme.
Code
How Sparkline is used: the demo's code. The component's own source comes with a free account.
Usage.tsx
import Sparkline from "@/components/ui/sparkline";

export default function SparklineDemo() {
  return (
    <div className="flex w-full flex-wrap items-center justify-center gap-8 p-10">
      <Sparkline
        values={[3, 5, 4, 8, 6, 9, 12, 10, 14, 13, 17]}
        tone="ok"
        showValue
      />
      <Sparkline
        values={[90, 82, 85, 70, 72, 60, 48, 52, 40, 33, 21]}
        tone="danger"
        showValue
        unit="%"
      />
      <Sparkline
        values={[40, 60, 40, 60, 40, 60, 40, 60]}
        scale="fixed"
        min={0}
        max={100}
        tone="brand"
      />
    </div>
  );
}
More by zweiundeins
View all
Theme Switch
11
Busy
7
Count Up
1
ECharts
Drawer

Starfield
Odometer
Meter