
About
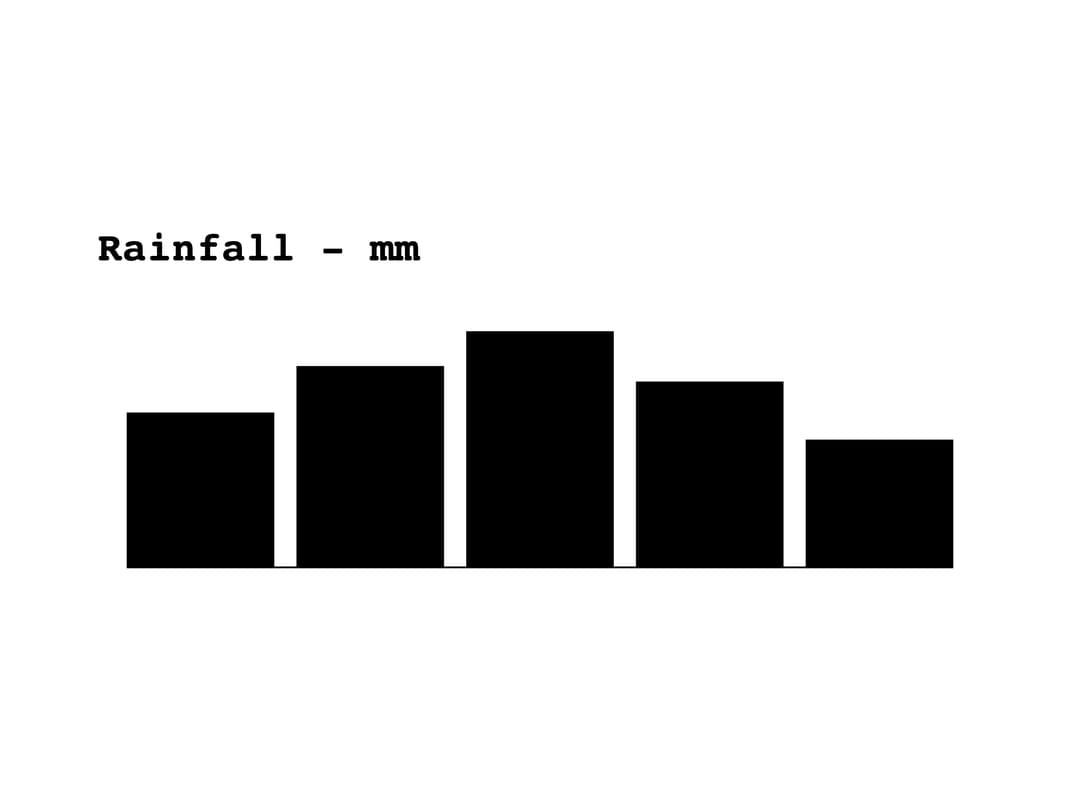
A grouped vertical bar chart that plots up to three numeric series using fill patterns (solid, striped, outline) instead of color, with an optional baseline axis, category labels, legend and median/average reference line, designed for low-contrast e-ink style displays.
Built with React and Tailwind. Copy the prompt and paste it into Claude Code, Cursor or Lovable: your agent adds Column Chart to your project and fits it to your theme.
Code
How Column Chart is used: the demo's code. The component's own source comes with a free account.
Usage.tsx
import ColumnChart from "@/components/ui/column-chart";

const categories = ["Jan", "Feb", "Mar", "Apr", "May"];

export default function ColumnChartDemo() {
  return (
    <div
      style={{
        background: "var(--eink-color-background)",
        color: "var(--eink-color-primary)",
      }}
      className="w-full h-screen flex items-center justify-center p-10"
    >
      <ColumnChart
        title="Rainfall"
        unit="mm"
        categories={categories}
        datasets={[{ label: "2026", data: [40, 52, 61, 48, 33] }]}
      />
    </div>
  );
}
More by alexisroe
View all
Log
7
Notification
2
Number Stepper
2
Segmented Control
2
Chip
2
Checkbox
1
E-Ink Code
QR Code