"use client";

import PieChart from "@/components/ui/pie-chart";

const data = [
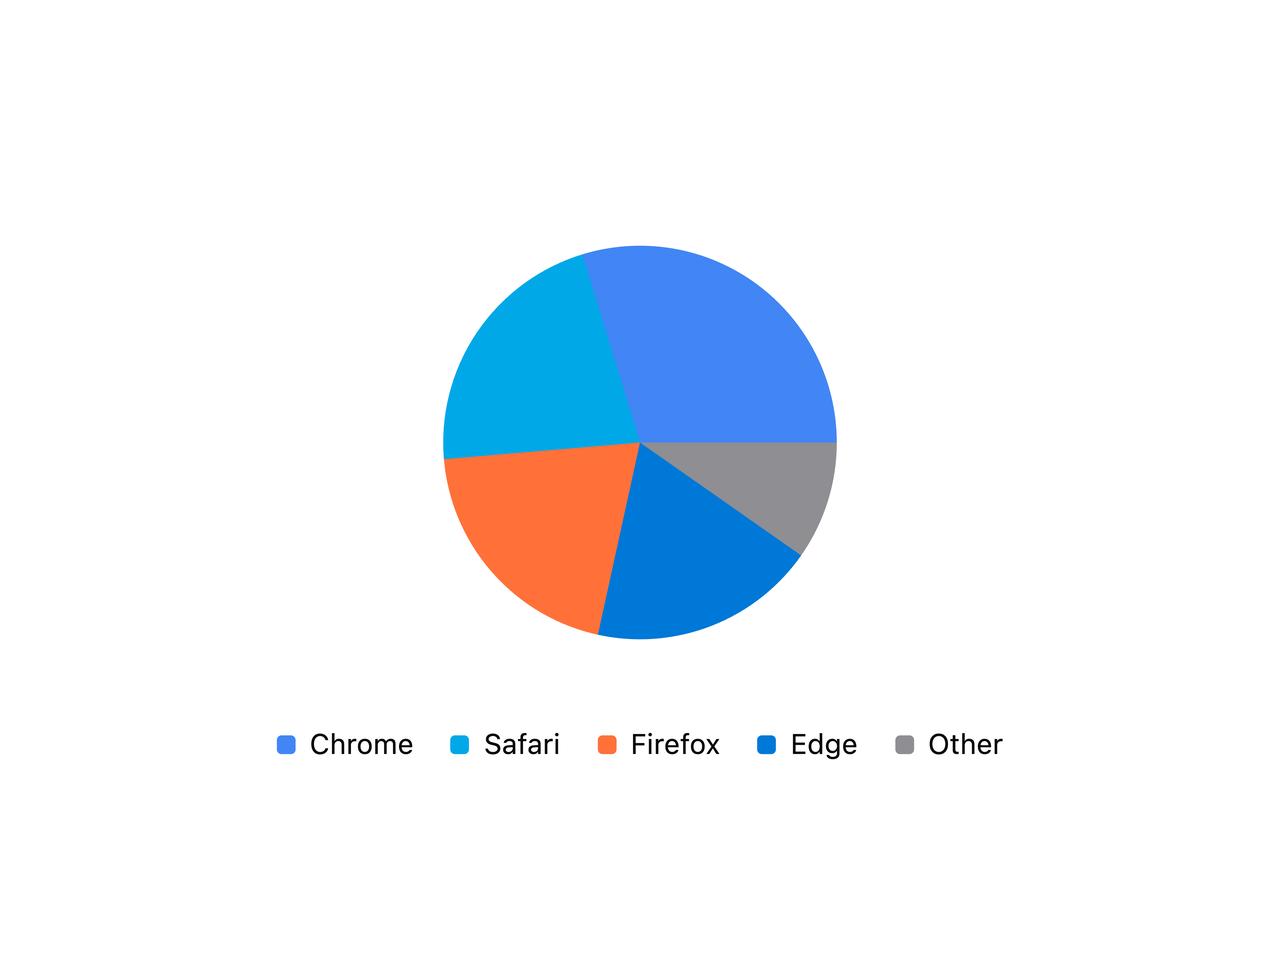
  { browser: "chrome", visitors: 275 },
  { browser: "safari", visitors: 200 },
  { browser: "firefox", visitors: 187 },
  { browser: "edge", visitors: 173 },
  { browser: "other", visitors: 90 },
];

const chartConfig = {
  chrome: {
    label: "Chrome",
    colors: { light: ["#4285F4"], dark: ["#4285F4"] },
  },
  safari: {
    label: "Safari",
    colors: { light: ["#00A8E8"], dark: ["#00A8E8"] },
  },
  firefox: {
    label: "Firefox",
    colors: { light: ["#FF7139"], dark: ["#FF7139"] },
  },
  edge: { label: "Edge", colors: { light: ["#0078D7"], dark: ["#0078D7"] } },
  other: { label: "Other", colors: { light: ["#8E8E93"], dark: ["#8E8E93"] } },
};

export default function PieChartDemo() {
  return (
    <div className="w-full max-w-md">
      <PieChart
        data={data}
        dataKey="visitors"
        nameKey="browser"
        chartConfig={chartConfig}
        legendVariant="rounded-square"
      />
    </div>
  );
}