
About
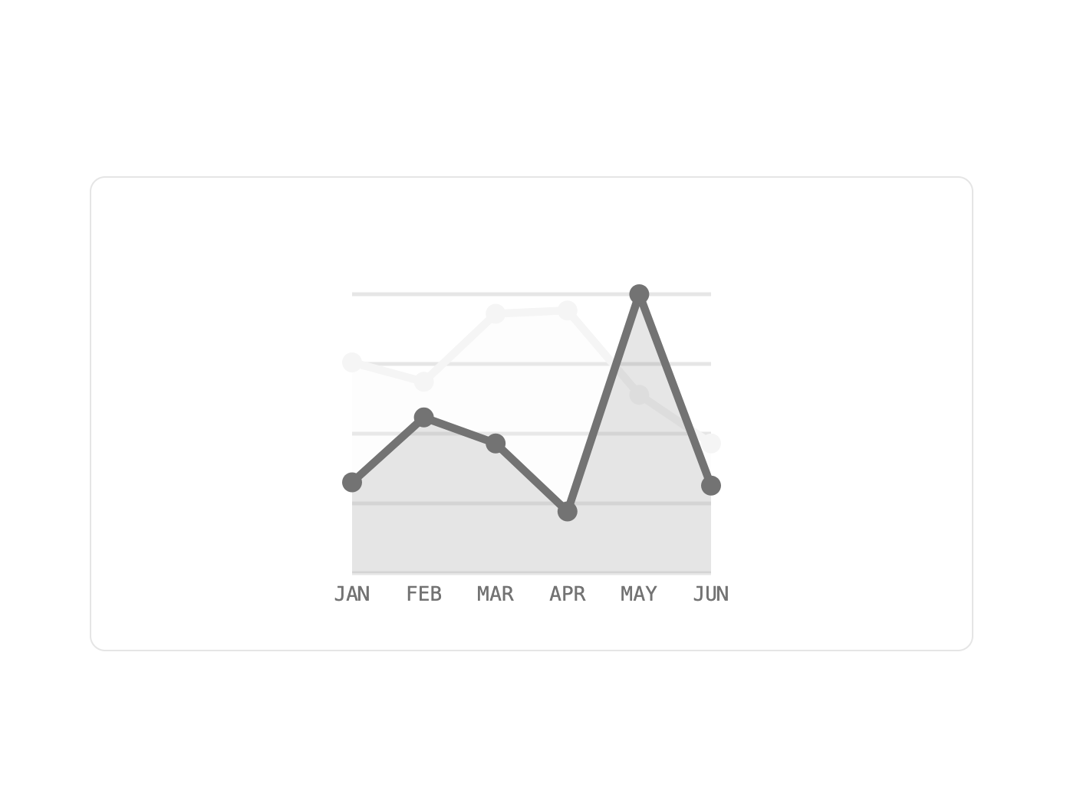
A lightweight SVG area chart that renders one or more filled, hoverable data series with gridlines and axis labels, for showing trends like visits or signups over time.
Built with React and Tailwind. Copy the prompt and paste it into Claude Code, Cursor or Lovable: your agent adds Area Chart to your project and fits it to your theme.
Code
How Area Chart is used: the demo's code. The component's own source comes with a free account.
Usage.tsx
"use client";

import { AreaChart } from "@/components/ui/area-chart";

const visits = [65, 59, 80, 81, 55, 40];
const signups = [28, 48, 40, 19, 86, 27];
const months = ["Jan", "Feb", "Mar", "Apr", "May", "Jun"];

export default function AreaChartDemo() {
  return (
    <div className="w-full max-w-xl rounded-lg border border-border bg-background p-6 text-foreground">
      <AreaChart
        series={[
          { id: "visits", label: "Visits", color: "accent", data: visits },
          { id: "signups", label: "Signups", color: "muted", data: signups },
        ]}
        labels={months}
        height={260}
      />
    </div>
  );
}
More by f0rextasy
View all
Newsletter Signup Card
17
Board Checklist
15
Network Graph
13
Stamp Seal
12
Navbar
10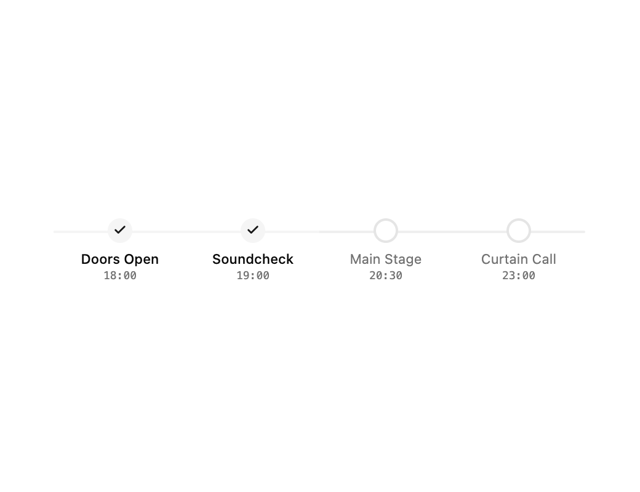
Milestone Chart
9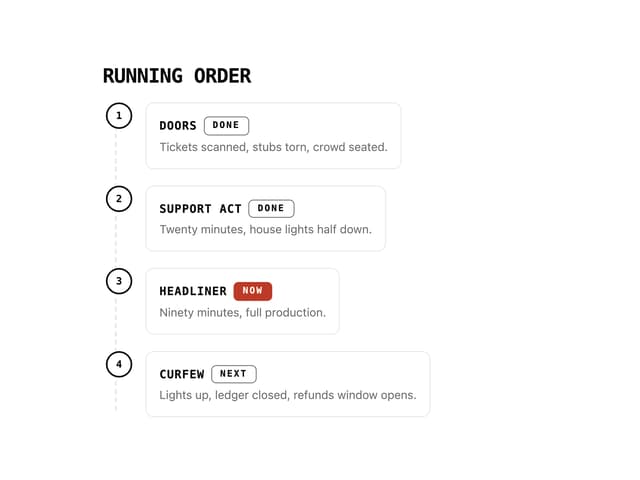
Running Order Timeline
8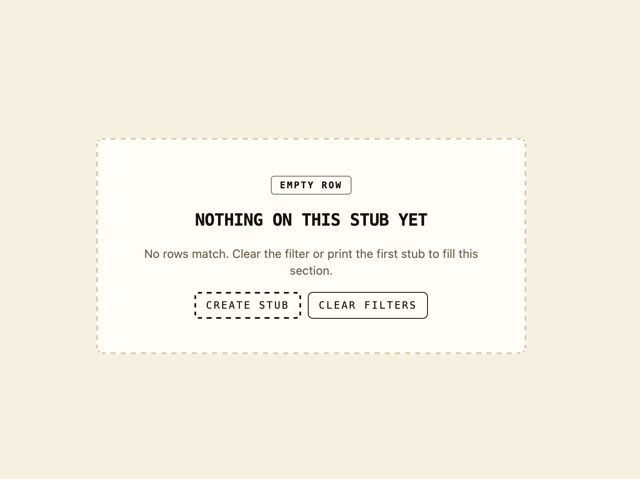
Empty State Card
6
More in Dashboards
View all
Dashboard with Collapsible Sidebar
2.6K

Sidebar
375
Stat Card
20

Fitness Bento Grid
24

SaaS Template
2.6K

Course Design Cards
1.3K

Financial Bento Grid
122
Stats Bento
1.2K


