
About
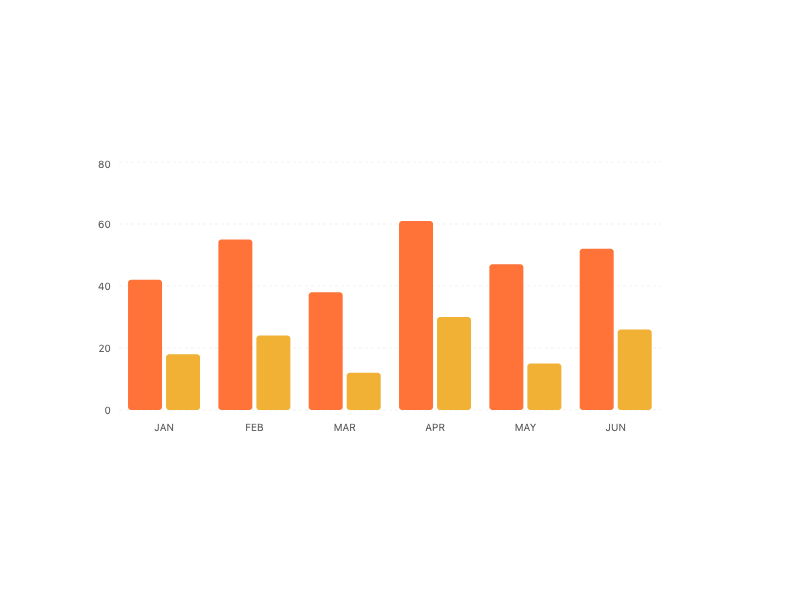
A themeable Recharts wrapper with styled tooltip and legend for building bar, line, area and pie charts.
Built with React and Tailwind. Copy the prompt and paste it into Claude Code, Cursor or Lovable: your agent adds Chart to your project and fits it to your theme.
Code
How Chart is used: the demo's code. The component's own source comes with a free account.
Usage.tsx
"use client";

import * as Recharts from "recharts";
import {
  ChartContainer,
  ChartTooltip,
  ChartTooltipContent,
} from "@/components/ui/chart";

const DATA = [
  { month: "JAN", forge: 42, drift: 18 },
  { month: "FEB", forge: 55, drift: 24 },
  { month: "MAR", forge: 38, drift: 12 },
  { month: "APR", forge: 61, drift: 30 },
  { month: "MAY", forge: 47, drift: 15 },
  { month: "JUN", forge: 52, drift: 26 },
];

const CONFIG = {
  forge: { label: "Forge", color: "var(--color-chart-1)" },
  drift: { label: "Drift", color: "var(--color-chart-2)" },
} as const;

export default function ChartDemo() {
  return (
    <div className="flex h-full w-full items-center justify-center bg-background p-8">
      <div className="h-72 w-full max-w-xl">
        <ChartContainer config={CONFIG} className="h-full w-full">
          <Recharts.BarChart data={DATA}>
            <Recharts.CartesianGrid vertical={false} strokeDasharray="3 3" />
            <Recharts.XAxis
              dataKey="month"
              tickLine={false}
              axisLine={false}
              fontSize={10}
              tickMargin={8}
            />
            <Recharts.YAxis
              width={24}
              tickLine={false}
              axisLine={false}
              fontSize={10}
            />
            <ChartTooltip
              content={<ChartTooltipContent />}
              cursor={{ fill: "oklch(1 0 0 / 0.04)" }}
            />
            <Recharts.Bar
              dataKey="forge"
              fill="var(--color-chart-1)"
              radius={3}
            />
            <Recharts.Bar
              dataKey="drift"
              fill="var(--color-chart-2)"
              radius={3}
            />
          </Recharts.BarChart>
        </ChartContainer>
      </div>
    </div>
  );
}
Dependencies
More by ghaerdi
View all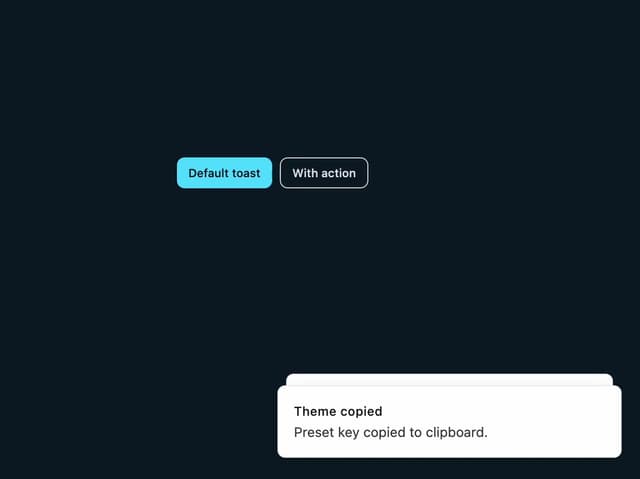
Toast Notification
3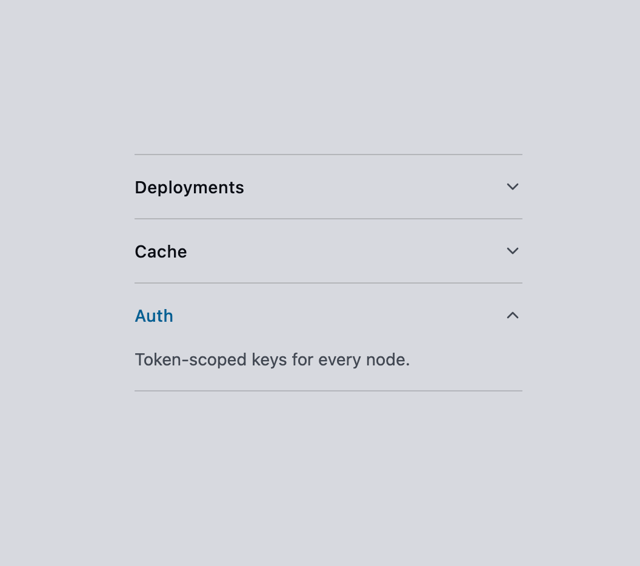
Accordion
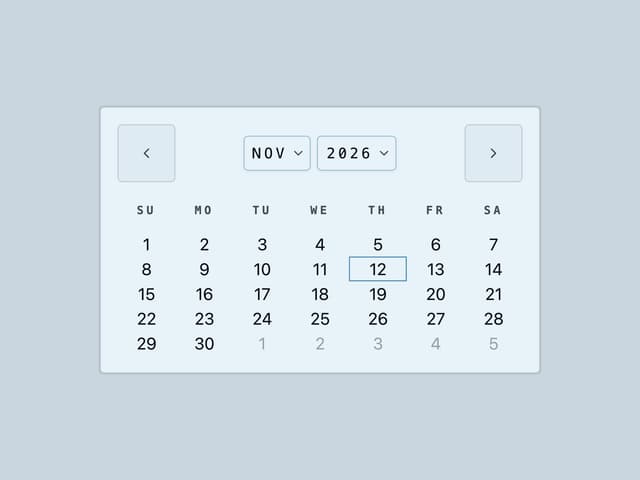
Calendar
Neon Glass Select
Carved Neon Input
Chamfered Glass Card