
About
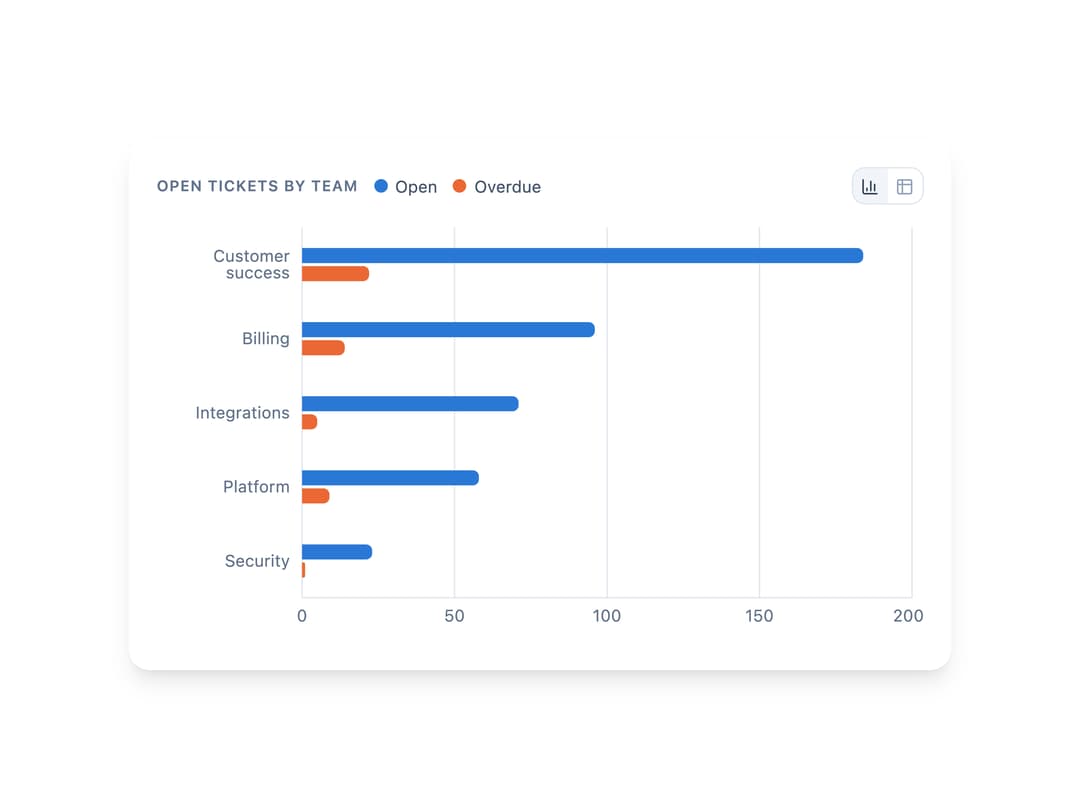
An accessible bar chart built on Recharts for comparing magnitude across categories, with grouped, stacked, or horizontal layouts and a one-click chart/table toggle.
Built with React and Tailwind. Copy the prompt and paste it into Claude Code, Cursor or Lovable: your agent adds Bar Chart to your project and fits it to your theme.
Code
How Bar Chart is used: the demo's code. The component's own source comes with a free account.
Usage.tsx
"use client";

import BarChart from "@/components/ui/bar-chart";
import { ThemeProvider } from "@/components/ui/bar-chart-utils/ThemeContext";

/** Open tickets by team, for a horizontal bar. */
const TICKETS_BY_TEAM = [
  { team: "Customer success", open: 184, overdue: 22 },
  { team: "Billing", open: 96, overdue: 14 },
  { team: "Integrations", open: 71, overdue: 5 },
  { team: "Platform", open: 58, overdue: 9 },
  { team: "Security", open: 23, overdue: 1 },
];

export default function BarChartHorizontalDemo() {
  return (
    <ThemeProvider>
      <div className="w-full max-w-2xl bg-background p-6">
        <BarChart
          title="Open tickets by team"
          data={TICKETS_BY_TEAM}
          x="team"
          series={[
            { key: "open", label: "Open", slot: 0 },
            { key: "overdue", label: "Overdue", slot: 1 },
          ]}
          horizontal
        />
      </div>
    </ThemeProvider>
  );
}
Dependencies
More by haassiib
View all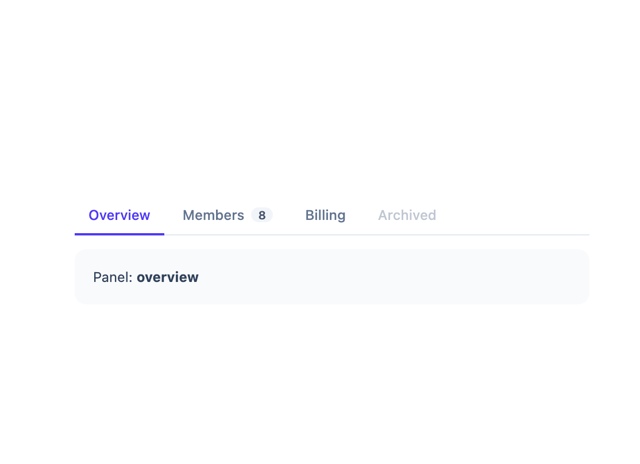
Tabs
9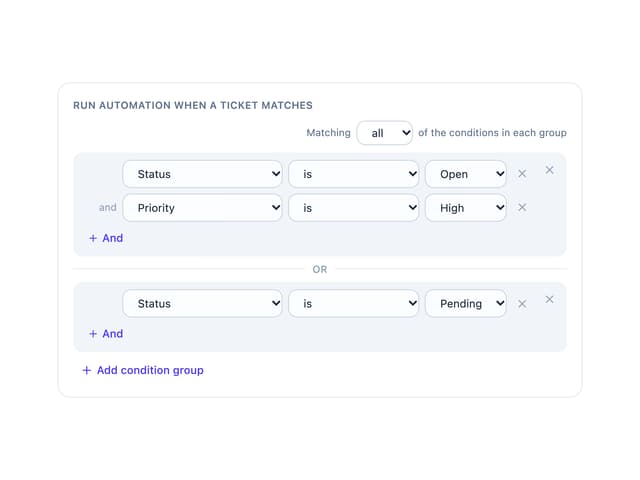
Condition Groups Builder
1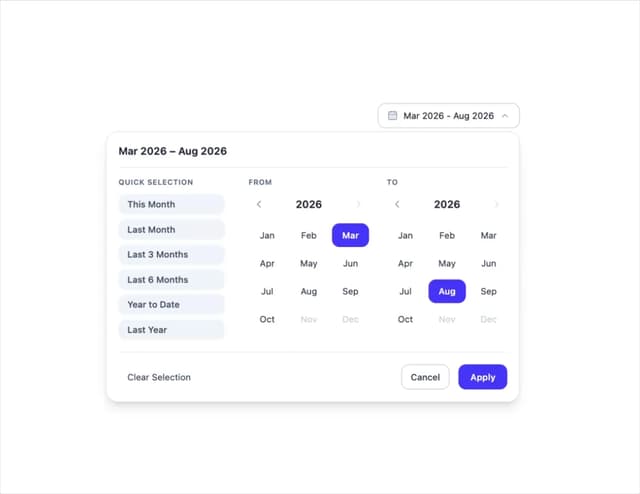
Month Range Picker
Tooltip
Draggable Resizable Modal
Filter Panel