
About
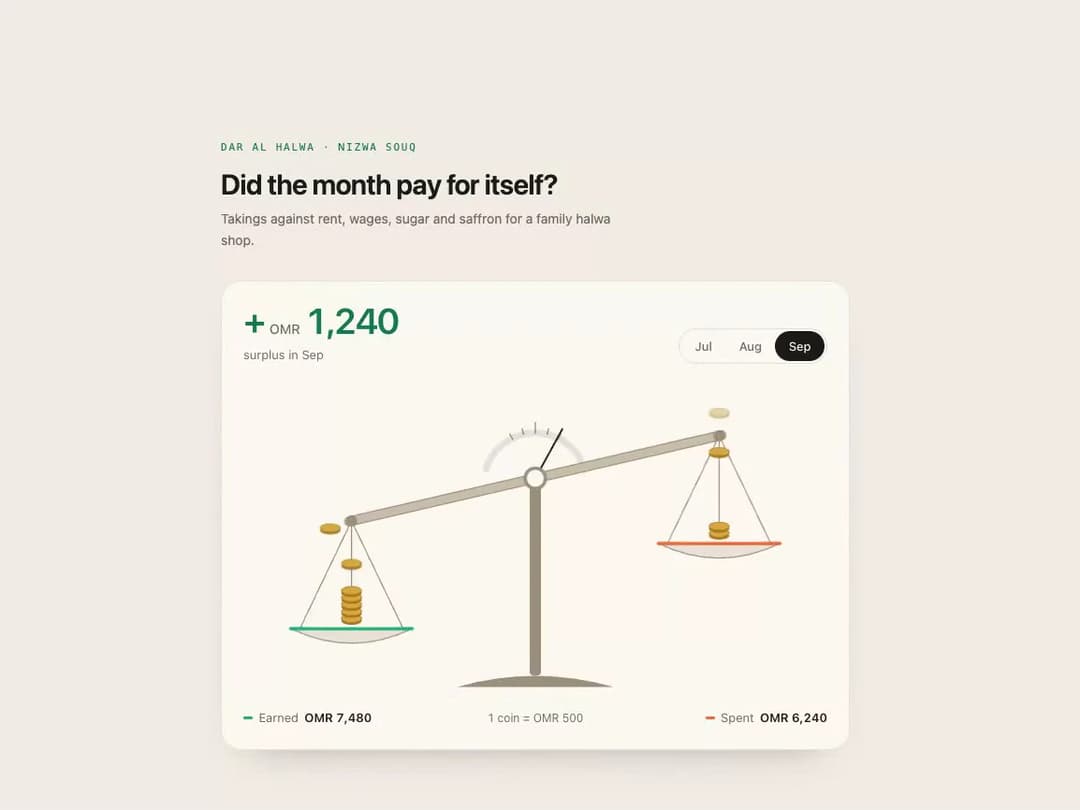
An animated SVG balance-scale chart that compares two monthly totals (like income vs. expenses) by dropping coins into two pans that tip and settle at an angle showing the surplus or shortfall.
Built with React and Tailwind. Copy the prompt and paste it into Claude Code, Cursor or Lovable: your agent adds Balance Stats to your project and fits it to your theme.
Code
How Balance Stats is used: the demo's code. The component's own source comes with a free account.
Usage.tsx
"use client";

import BalanceStats from "@/components/ui/balance-stats";

export default function Demo() {
  return (
    <div className="flex min-h-full w-full items-center justify-center px-4 py-12 bg-[#f0ece4] text-[#1b1a17]">
      <div className="w-full max-w-2xl">
        <p className="font-mono text-[11px] uppercase tracking-[0.16em] text-[#137a52]">
          Dar Al Halwa · Nizwa souq
        </p>
        <h2 className="mt-3 text-2xl font-semibold tracking-tight sm:text-3xl">
          Did the month pay for itself?
        </h2>
        <p className="mt-2 max-w-md text-sm leading-relaxed text-[#6f6a62]">
          Takings against rent, wages, sugar and saffron for a family halwa
          shop.
        </p>
        <BalanceStats
          className="mt-8"
          theme="paper"
          title="Takings against costs"
          months={[
            { label: "Jul", left: 6840, right: 5600 },
            { label: "Aug", left: 5920, right: 6310 },
            { label: "Sep", left: 7480, right: 6240 },
          ]}
        />
      </div>
    </div>
  );
}
More by ham7a311
View all
Wave Mesh
137
Route Globe
125
Glass Tiles
109
Glyph Swell
50
Orbit Ring Stats
47
Ask Bar
38
Glass Ribbons
30
Intent Label
29