
About
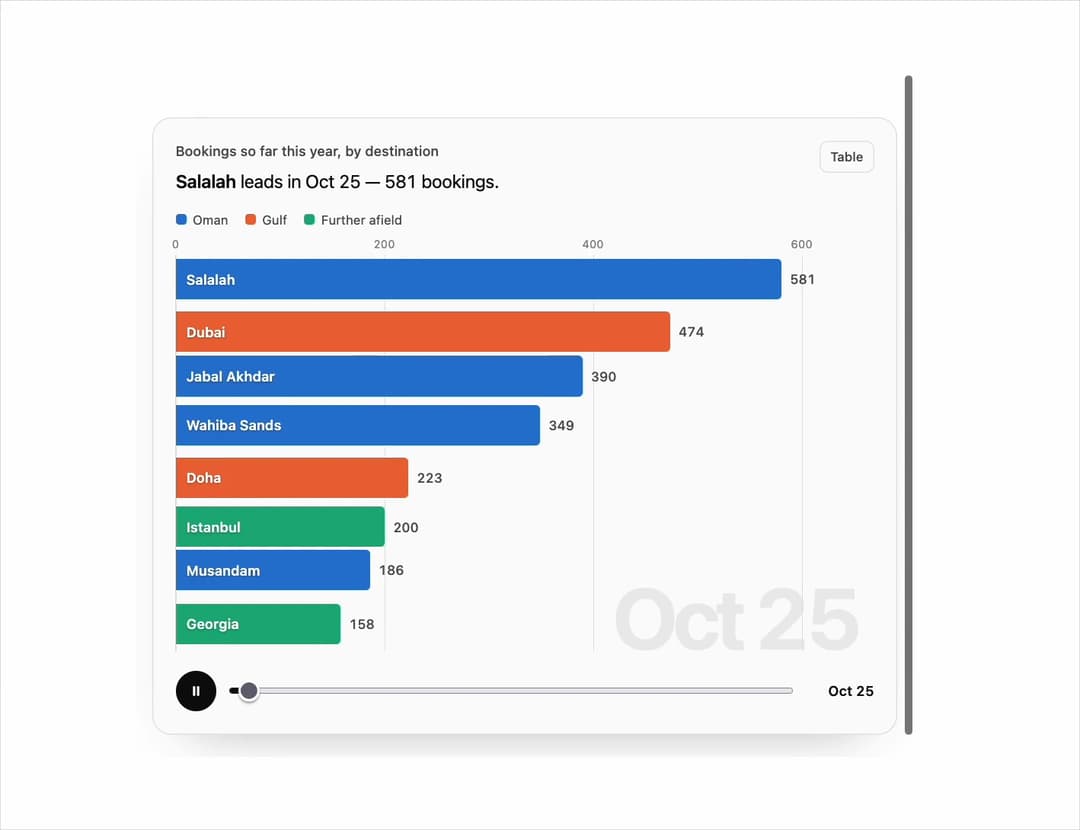
An animated bar chart race that re-ranks items like destinations or products month by month, with bars growing, overtaking and sliding past each other, a counting value, and a play/pause scrubber.
Built with React and Tailwind. Copy the prompt and paste it into Claude Code, Cursor or Lovable: your agent adds Bar Race to your project and fits it to your theme.
Code
How Bar Race is used: the demo's code. The component's own source comes with a free account.
Usage.tsx
"use client";

import { BarRace, type Racer } from "@/components/ui/bar-race";

const MONTHS = [
  "Oct 25",
  "Nov 25",
  "Dec 25",
  "Jan 26",
  "Feb 26",
  "Mar 26",
  "Apr 26",
  "May 26",
  "Jun 26",
  "Jul 26",
  "Aug 26",
  "Sep 26",
];
/** Cumulative bookings: each destination has its own season. */
const R = (
  name: string,
  region: 0 | 1 | 2,
  base: number,
  peak: number,
  width = 2,
): Racer => {
  let sum = 0;
  return {
    name,
    region,
    values: MONTHS.map((_, m) => {
      sum +=
        base *
        (0.4 +
          1.6 * Math.exp(-Math.pow(((m - peak + 12) % 12) / width, 2)) +
          0.25 * Math.exp(-Math.pow(((m - peak - 12) % 12) / width, 2)));
      return Math.round(sum);
    }),
  };
};
const RACERS: Racer[] = [
  R("Salalah", 0, 1180, 9.8, 1.2),
  R("Jabal Akhdar", 0, 780, 3, 2.4),
  R("Wahiba Sands", 0, 640, 2, 2),
  R("Musandam", 0, 420, 4, 2),
  R("Dubai", 1, 820, 2.5, 3),
  R("AlUla", 1, 300, 3.5, 1.6),
  R("Doha", 1, 380, 2, 2.5),
  R("Istanbul", 2, 450, 7, 2.2),
  R("Georgia", 2, 360, 8, 1.6),
  R("Zanzibar", 2, 330, 5.5, 2),
];

export default function Demo() {
  return (
    <div className="flex min-h-full w-full items-center justify-center bg-background px-4 py-10">
      <BarRace
        racers={RACERS}
        months={MONTHS}
        regions={["Oman", "Gulf", "Further afield"]}
        title="Bookings so far this year, by destination"
        theme="light"
      />
    </div>
  );
}
More by ham7a311
View all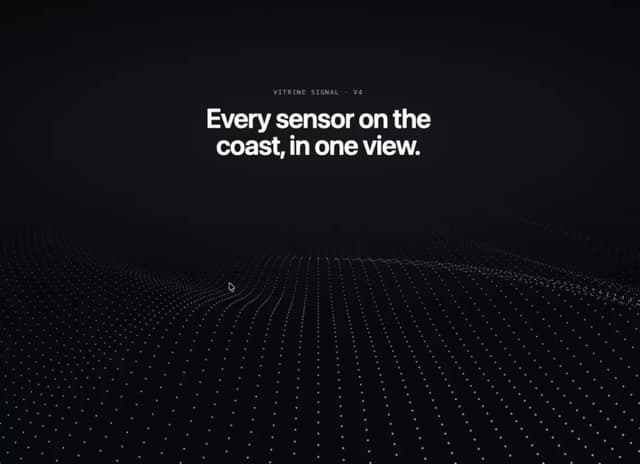
Wave Mesh
137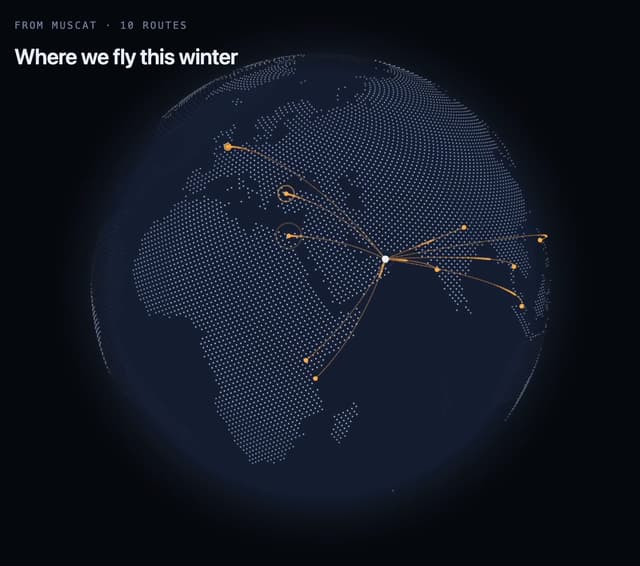
Route Globe
125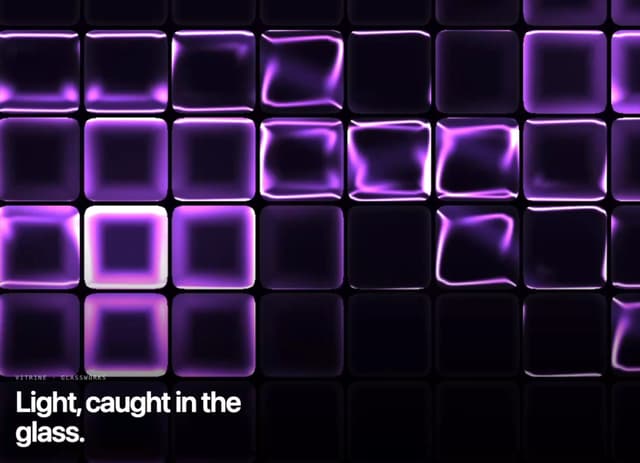
Glass Tiles
109
Glyph Swell
50
Orbit Ring Stats
47
Ask Bar
38
Glass Ribbons
30
Intent Label
29