
About
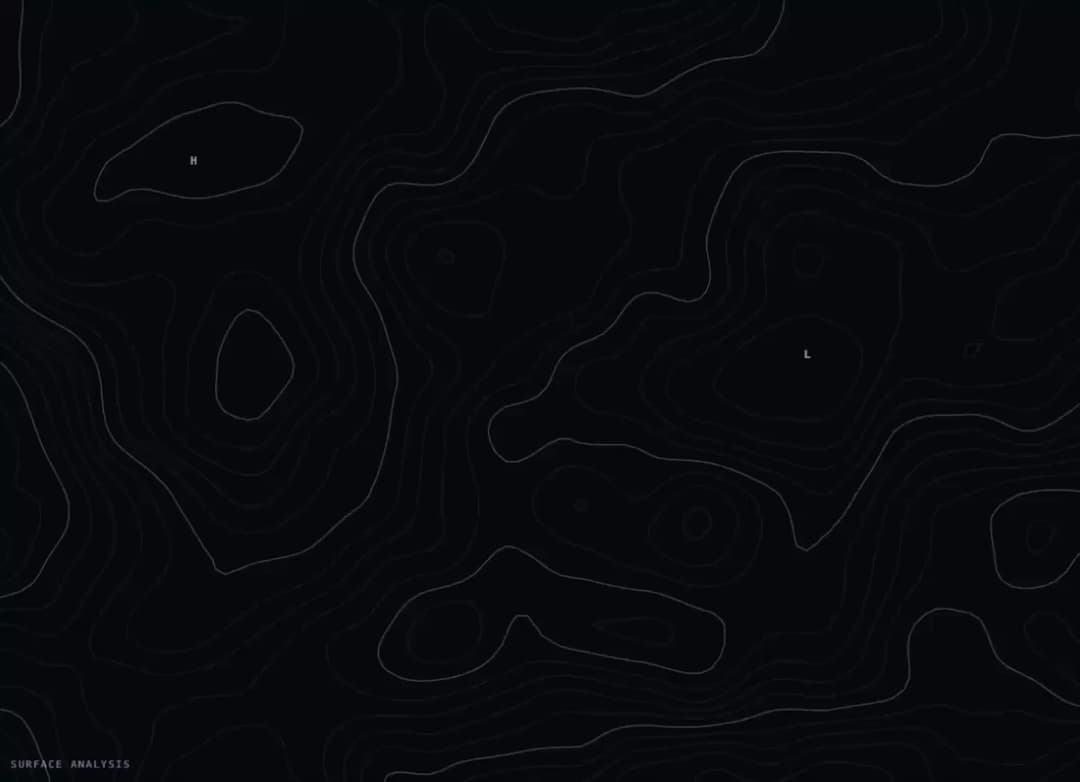
An animated canvas background that renders a living weather map, with drifting pressure-field contour lines (isobars) that bend around the cursor like a surface-analysis chart.
Built with React and Tailwind. Copy the prompt and paste it into Claude Code, Cursor or Lovable: your agent adds Isobar Weather Map Background to your project and fits it to your theme.
Code
How Isobar Weather Map Background is used: the demo's code. The component's own source comes with a free account.
Usage.tsx
"use client";

import { Isobar } from "@/components/ui/isobar";

const THEMES: Record<string, [string, string]> = {
  frost: ["#b9cce4", "#07080c"],
  lilac: ["#c8b9ea", "#0c0910"],
  paper: ["#2a1830", "#ece4d6"],
};

export default function IsobarDemo({
  variant = "frost",
}: {
  variant?: string;
}) {
  const [color, bg] = THEMES[variant] ?? THEMES.frost;
  return (
    <div className="w-full h-screen">
      <Isobar
        color={color}
        background={bg}
        className="h-full min-h-full w-full"
      >
        <div
          className="pointer-events-none flex h-full items-end justify-between p-6 font-mono text-[11px] uppercase tracking-[0.16em]"
          style={{ color, opacity: 0.6 }}
        >
          <span>Surface analysis</span>
          <span>1013 hPa</span>
        </div>
      </Isobar>
    </div>
  );
}
More by ham7a311
View all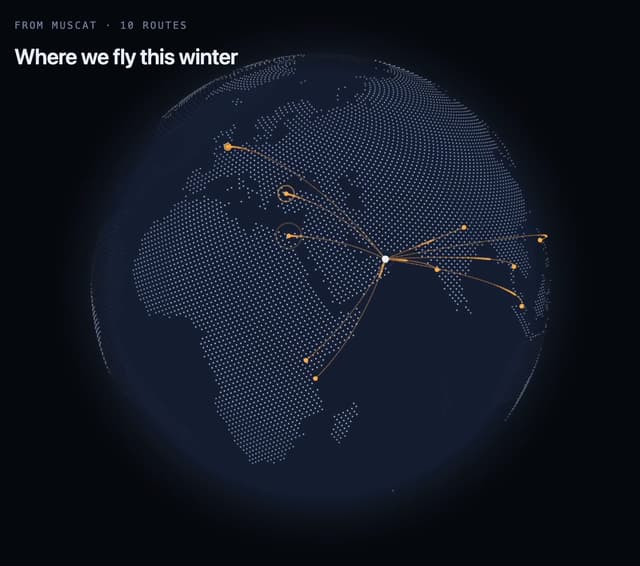
Route Globe
6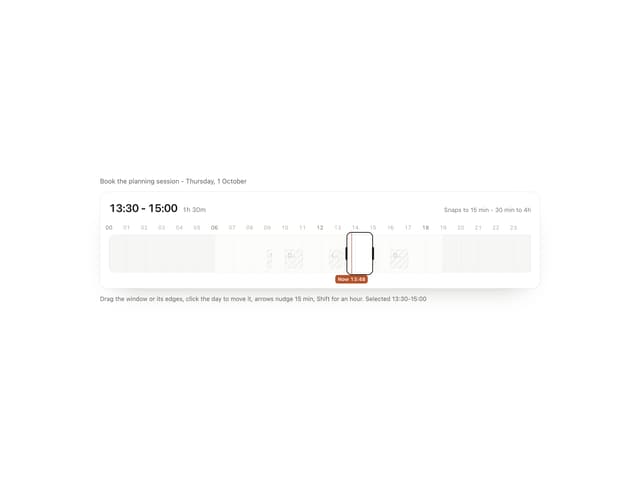
Time Window
4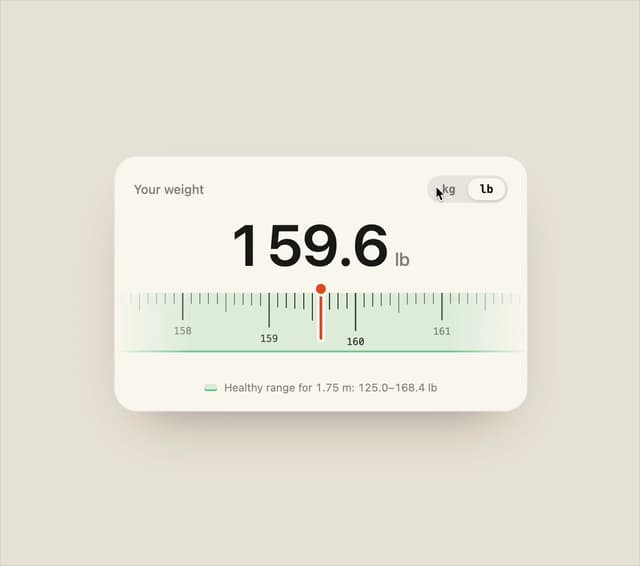
Ruler Picker
4
Wave Mesh
4
Second Draft Text
3
Uptime Ribbon
3
Glass Carousel
3
Liquid Chrome
3
More in Backgrounds
View all
Elegant Dark Pattern
805

Background snippets
63

Background Components
16
Light theme Tailwind CSS Background Snippet
220
Gradient Backgrounds
23
Tailwind CSS Background Snippet
528
Cotton Bubblegum Lilac
5
Glass Fold
187


