
About
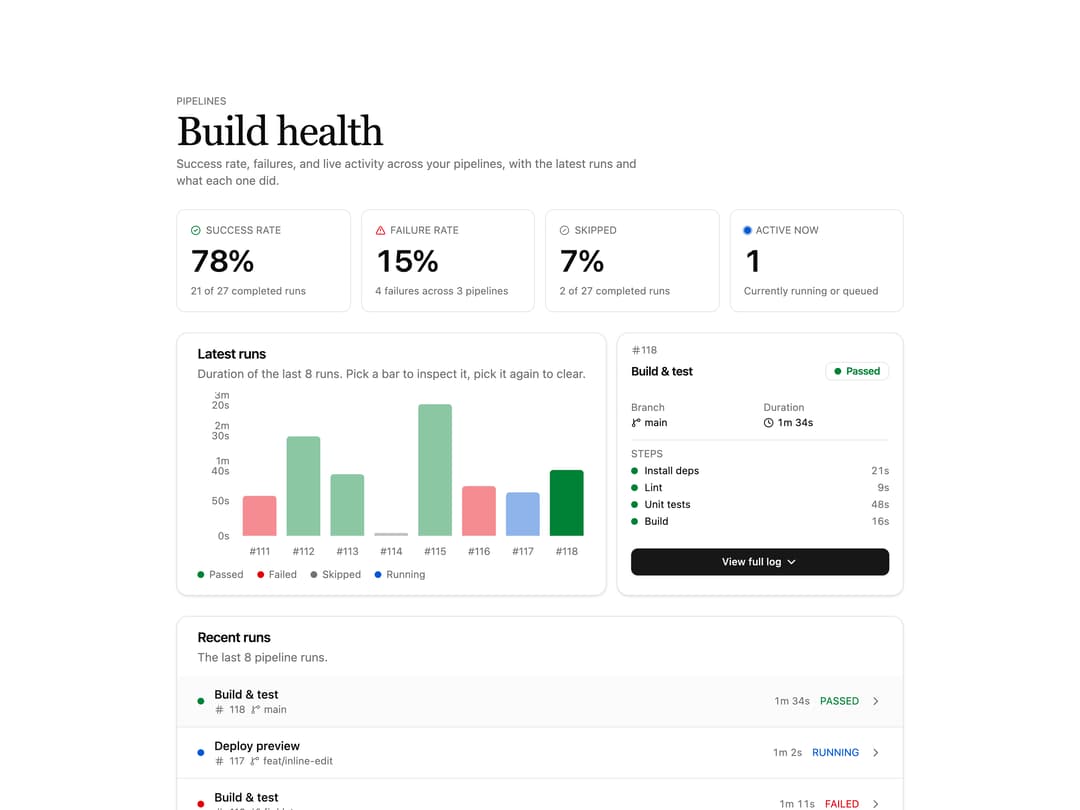
Pipeline overview dashboard: four stat cards for success, failure, skipped, and live activity, a clickable latest-runs bar chart with a run breakdown panel, and a recent-runs list. The active-now stat uses the primary color for live state; every color is a theme token, so it works in light and dark.
Built with React and Tailwind. Copy the prompt and paste it into Claude Code, Cursor or Lovable: your agent adds Pipeline Dashboard to your project and fits it to your theme.
Code
How Pipeline Dashboard is used: the demo's code. The component's own source comes with a free account.
Usage.tsx
import Dashboard06 from "@/components/ui/dashboard-06";

export default function Preview() {
  return <Dashboard06 />;
}
Dependencies
More by Mohammad Shehadeh
View all
Feature Problem Cards
94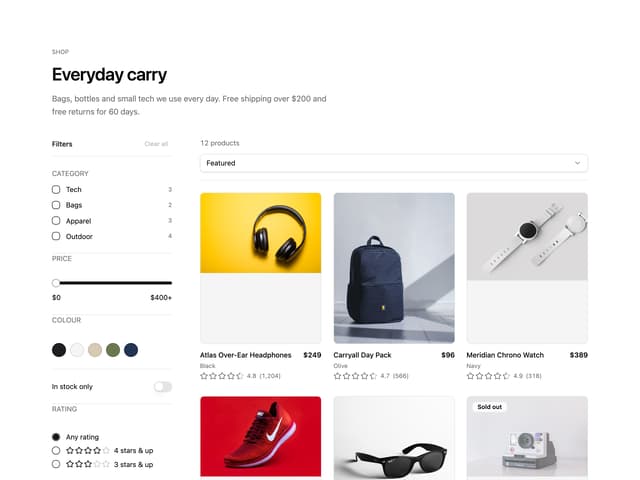
Ecommerce Category Page
83
Feature Grid Spotlight Cards
83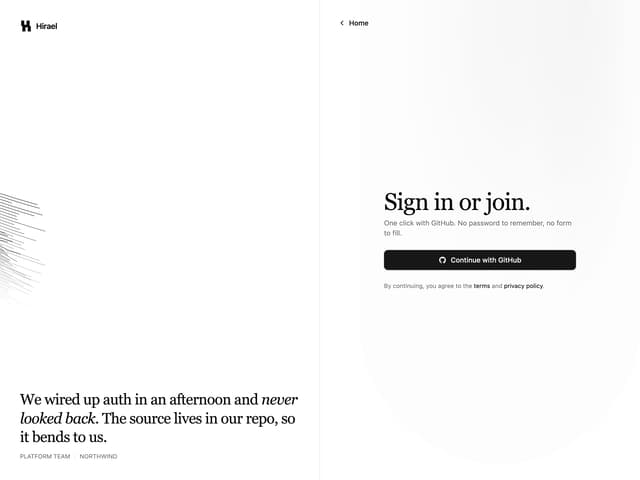
Split Login
76
Comparison Section
71
FAQ Two Column
71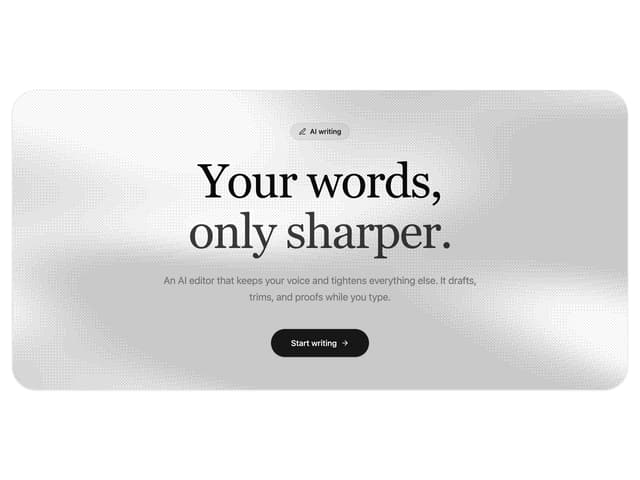
Dithered Shader CTA
70
Comparison Table
66
More in Dashboards
View all
Dashboard with Collapsible Sidebar
2.5K

Sidebar
343

SaaS Template
2.6K
Stats cards with links
40

Course Design Cards
1.2K
Stats Bento
1.2K

Financial Bento Grid
104

Chat template
639


