
About
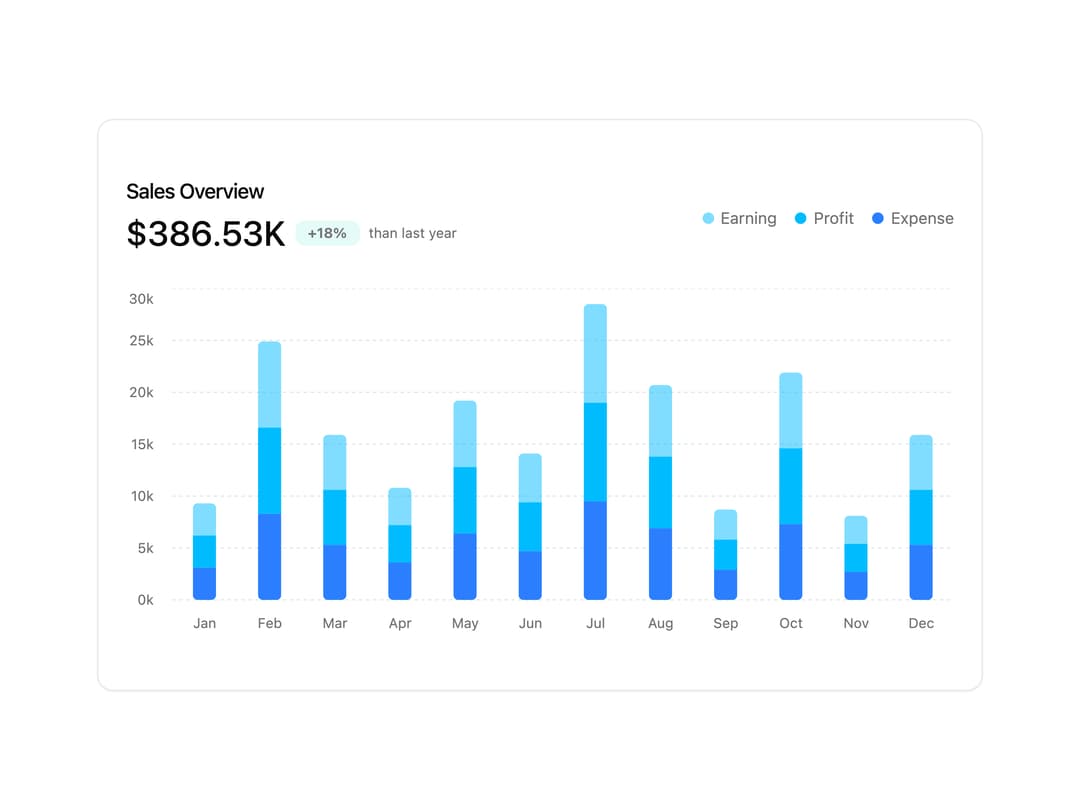
A stacked bar chart card that shows monthly earnings, profit, and expenses with a total figure and legend, useful for admin dashboards tracking financial trends.
Built with React and Tailwind. Copy the prompt and paste it into Claude Code, Cursor or Lovable: your agent adds Sales Overview Bar Chart to your project and fits it to your theme.
Code
How Sales Overview Bar Chart is used: the demo's code. The component's own source comes with a free account.
Usage.tsx
import Chart01 from "@/components/ui/chart-01";

export default function Chart01Demo() {
  return (
    <div className="w-full flex items-center justify-center p-6">
      <Chart01 />
    </div>
  );
}
Dependencies
More by ShadcnSpace
View all
Integration Card
1.9K
Stacked Card Carousel
1.6K
Button witn Icon
1.5K
Orbiting Circles with Globe
1.4K
Agency Hero Section
992
Testimonials Marquee
660
Shine Border
489
Range Select Calendar
484
More in Dashboards
View all
Dashboard with Collapsible Sidebar
2.6K

Sidebar
387
Stat Card
35

Fitness Bento Grid
35

SaaS Template
2.7K
Stats Bento
1.2K

Course Design Cards
1.3K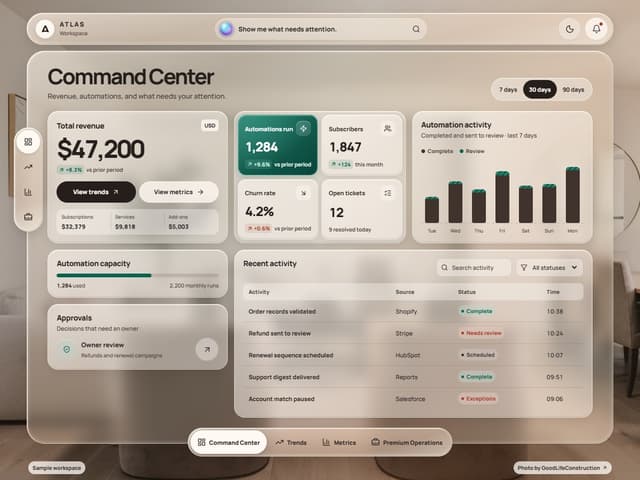

Glassy Dashboard
17


