
About
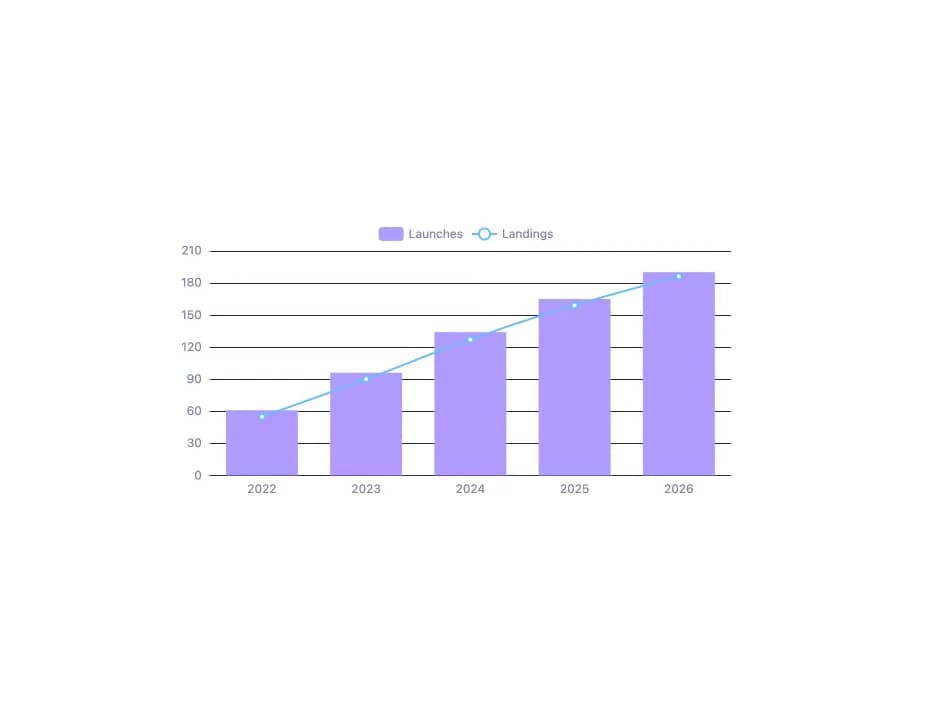
A themeable Apache ECharts wrapper that draws a chart from a plain option object, auto-colors it from your design tokens and theme changes, formats numbers/dates in the current locale, keeps the legend and zoom slider clear of the axes, and supports keyboard navigation. Ported to React from zweiundeins/starbase's `<sb-echarts>` web component (MIT), itself ported from Libretto's `<tco-chart>`.
Built with React and Tailwind. Copy the prompt and paste it into Claude Code, Cursor or Lovable: your agent adds ECharts to your project and fits it to your theme.
Code
How ECharts is used: the demo's code. The component's own source comes with a free account.
Usage.tsx
"use client";

import EChart from "@/components/ui/echarts";

export default function EChartDefaultDemo() {
  return (
    <div
      className="w-full h-full flex items-center justify-center p-6"
      style={{ background: "var(--background)" }}
    >
      <div className="w-full max-w-xl" style={{ height: "320px" }}>
        <EChart
          option={{
            tooltip: { trigger: "axis" },
            legend: { data: ["Launches", "Landings"], top: 0 },
            xAxis: {
              type: "category",
              data: ["2022", "2023", "2024", "2025", "2026"],
            },
            yAxis: { type: "value" },
            series: [
              { name: "Launches", type: "bar", data: [61, 96, 134, 165, 190] },
              {
                name: "Landings",
                type: "line",
                smooth: true,
                data: [55, 90, 127, 159, 186],
              },
            ],
          }}
        />
      </div>
    </div>
  );
}
More by zweiundeins
View all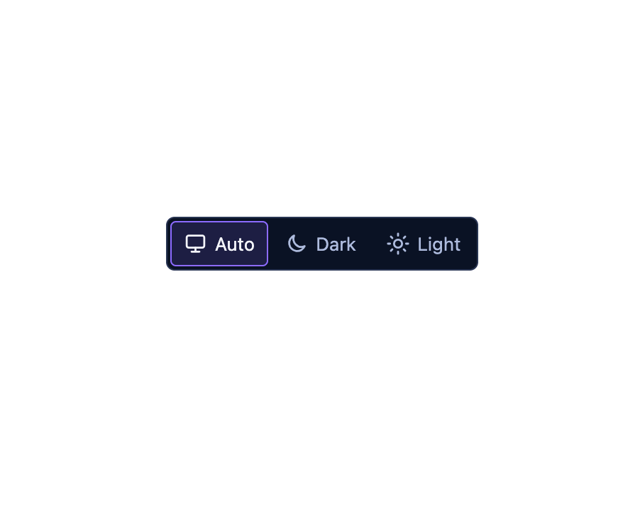
Theme Switch
11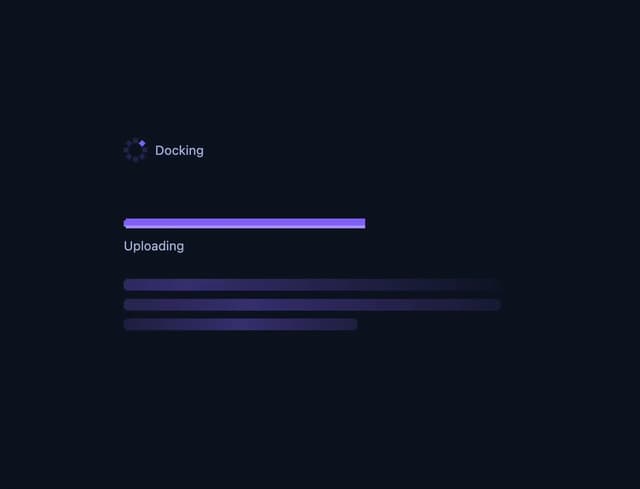
Busy
7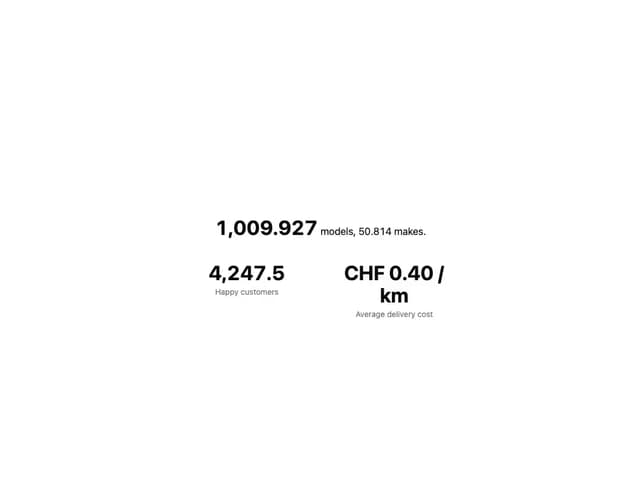
Count Up
1
Sparkline
Drawer

Starfield
Odometer
Meter