
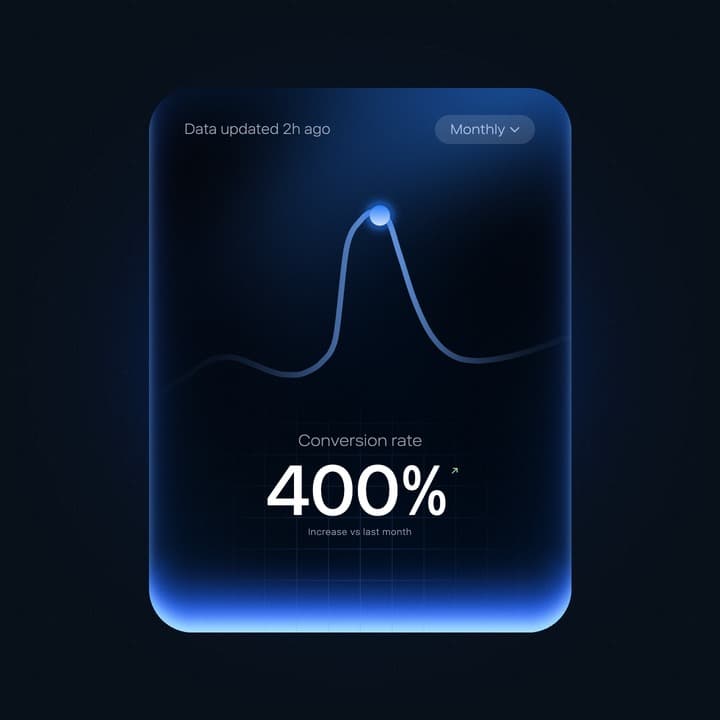
About
A glowing navy stat card whose blue line chart draws in, lands a pulsing dot on its peak and counts the headline figure up, with live hover.
Built with React and Tailwind. Copy the prompt and paste it into Claude Code, Cursor or Lovable: your agent adds Peak Chart to your project and fits it to your theme.
Code
How Peak Chart is used: the demo's code. The component's own source comes with a free account.
Usage.tsx
"use client"

import * as React from "react"
import { PeakChart } from "@/components/ui/peak-chart"

export default function PeakChartDemo() {
  return (
    <div className="flex min-h-screen w-full items-center justify-center p-8">
      <PeakChart backdrop width={420} />
    </div>
  )
}
More by Louis's Graphics
View all

Liquid Chrome

Melt Mark
Effort Slider
Glass Tabs

Thinking Pill

Metaball Loader
Glow Button

Orb Loader
More in Cards
View all

Course Design Cards
1.2K

Card Studio
11

Interactive Tech Stack Bento Grid with Hover Effects
329

Card
70
Statistics Card 2
283
Stats cards with links
88
The Item one
3
Statistics Card 10
277
