
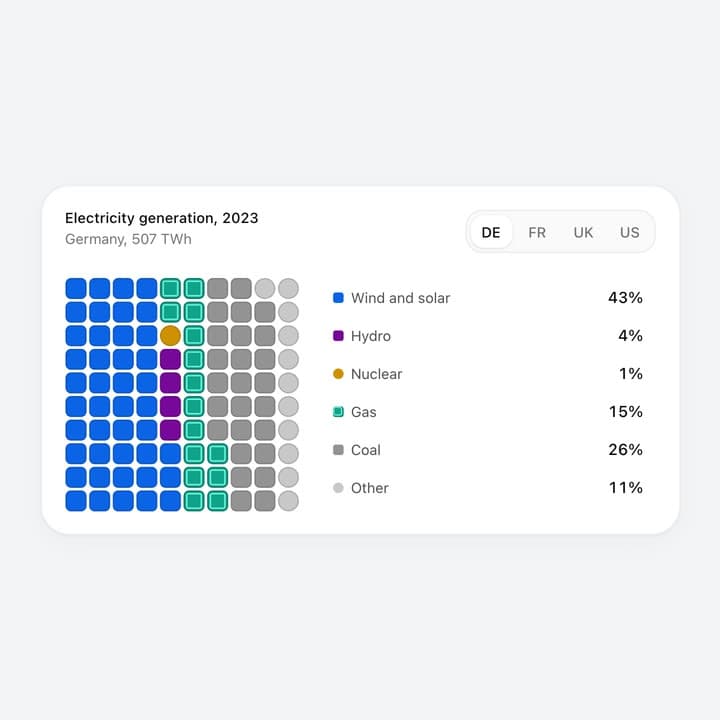
About
A waffle chart stat card. Pick a tab and its hundred cells fly, shrink and recolour to the new data set while the legend percentages count; hover a legend row or a cell to dim the rest and read a tooltip. Your own categories, data sets and colours as props. More like this, plus a designer your coding agent can use, at studios.lou15.com/?ref=21st
Built with React and Tailwind. Copy the prompt and paste it into Claude Code, Cursor or Lovable: your agent adds Waffle Chart to your project and fits it to your theme.
Code
How Waffle Chart is used: the demo's code. The component's own source comes with a free account.
Usage.tsx
"use client";

import * as React from "react";
import { WaffleChart } from "@/components/ui/waffle-chart";

/** A waffle chart card: pick a tab and its hundred cells fly and recolour to the new data; hover the legend or a cell to read its share. */
export default function WaffleChartDemo() {
  return (
    <main className="relative h-screen min-h-[340px] w-full overflow-hidden" style={{ backgroundColor: "#f2f3f5" }}>
      <WaffleChart style={{ width: "100%", height: "100%" }} />
    </main>
  );
}
More by Louis Studios
View all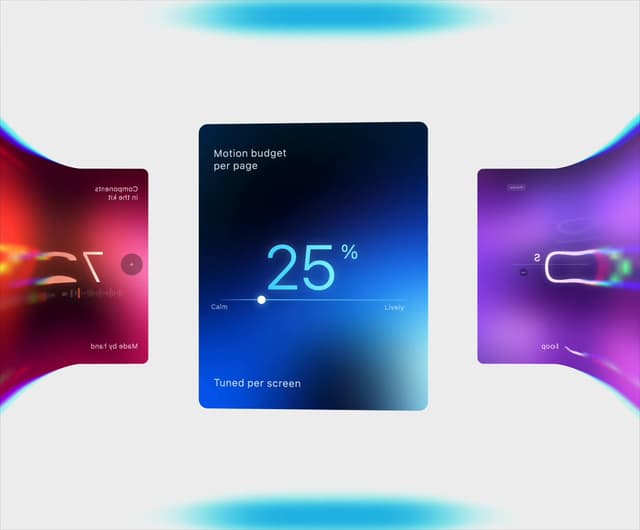

Warp Carousel
643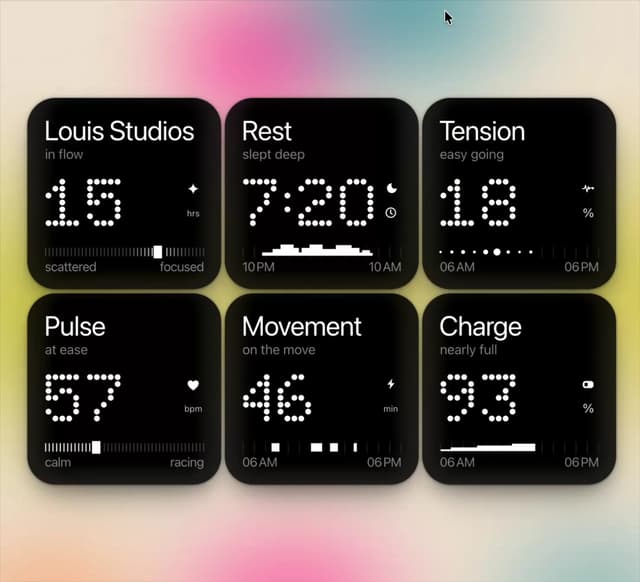
Dot Tiles
132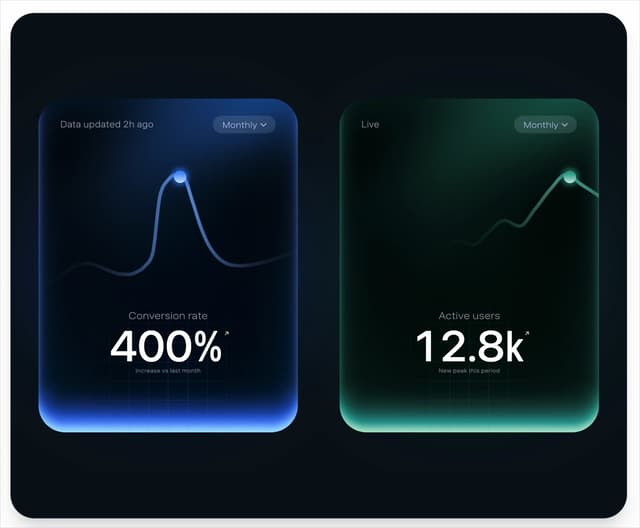
Peak Chart
118
Chapter Player
87
Glow Rocker
69
LED Badges
66
Chrome Arcs
53
Lens Clock
49
More in Cards
View all
Stats cards with links
94

Card
71
Statistics Card 7
318

Course Design Cards
1.2K
Statistics Card 2
297

Interactive Tech Stack Bento Grid with Hover Effects
516

Card Studio
14

Card
18
