About
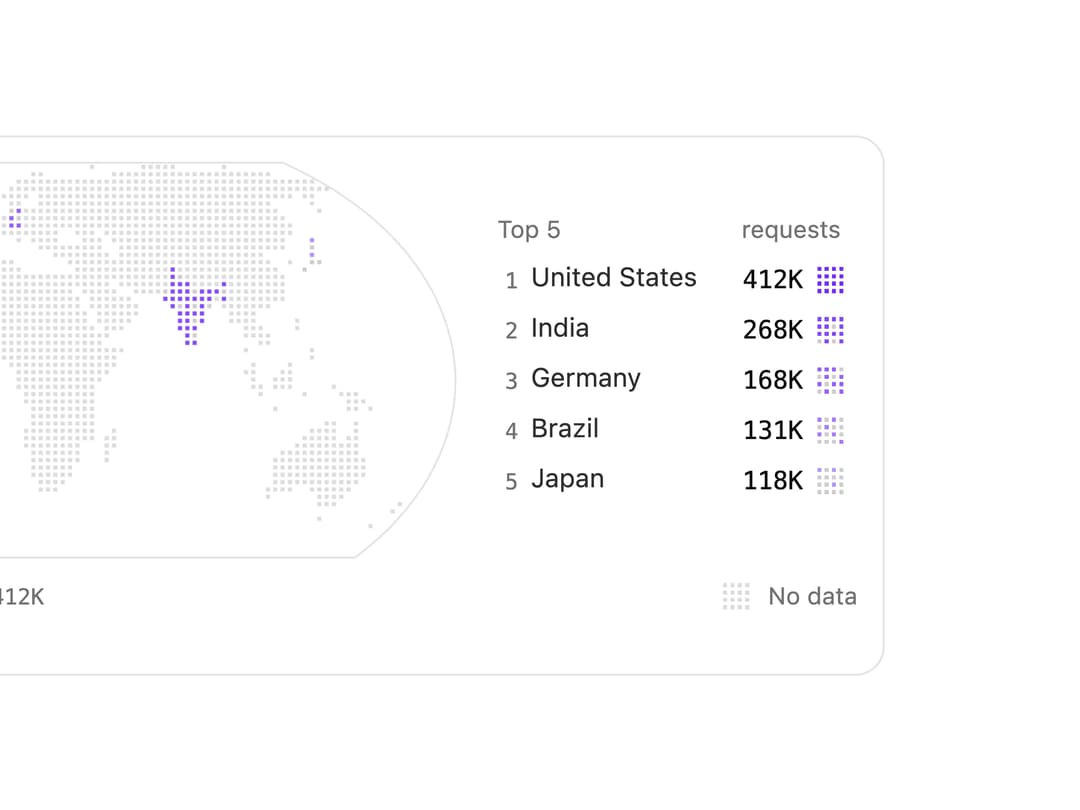
An interactive world map that shows a numeric value per country as a dot-density pattern, with a ranked list, hover tooltip and keyboard navigation.
Built with React and Tailwind. Copy the prompt and paste it into Claude Code, Cursor or Lovable: your agent adds Choropleth Map to your project and fits it to your theme.
Code
How Choropleth Map is used: the demo's code. The component's own source comes with a free account.
Usage.tsx
"use client";

import {
  GeoChoropleth,
  type CountryValue,
} from "@/components/ui/geo-choropleth";

const requests: CountryValue[] = [
  { code: "US", value: 412000 },
  { code: "IN", value: 268000 },
  { code: "DE", value: 168000 },
  { code: "BR", value: 131000 },
  { code: "JP", value: 118000 },
];

export default function GeoChoroplethDemo() {
  return (
    <div className="w-full">
      <GeoChoropleth
        label="Requests by country"
        unit="requests"
        data={requests}
        onValueChange={(code) => console.log(code)}
      />
    </div>
  );
}
More by lumesec
View all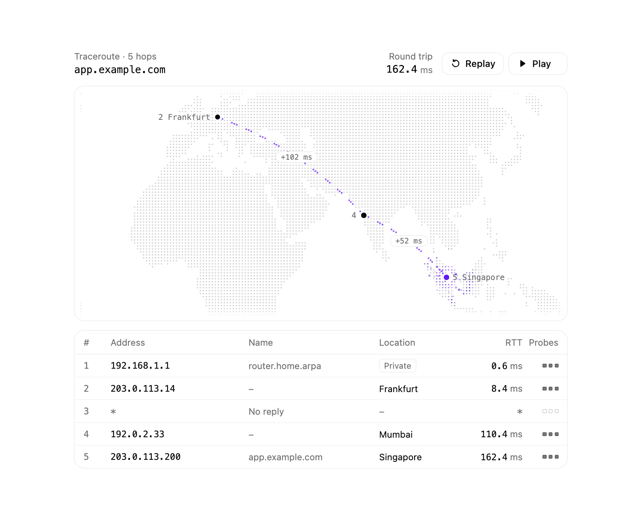

Geo Traceroute
2
Copy Button
More in Dashboards
View all
Dashboard with Collapsible Sidebar
2.5K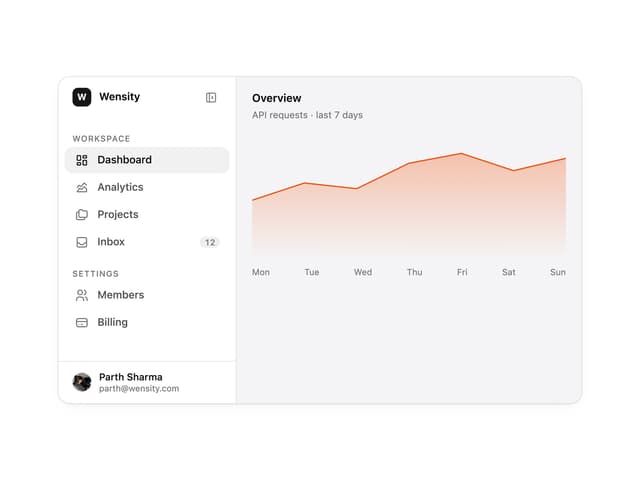

Sidebar
309

SaaS Template
2.5K
Stats Bento
1.1K

Invoice History Table
80

Data Grid Table
8

Course Design Cards
1.1K

System Status Block
323

