About
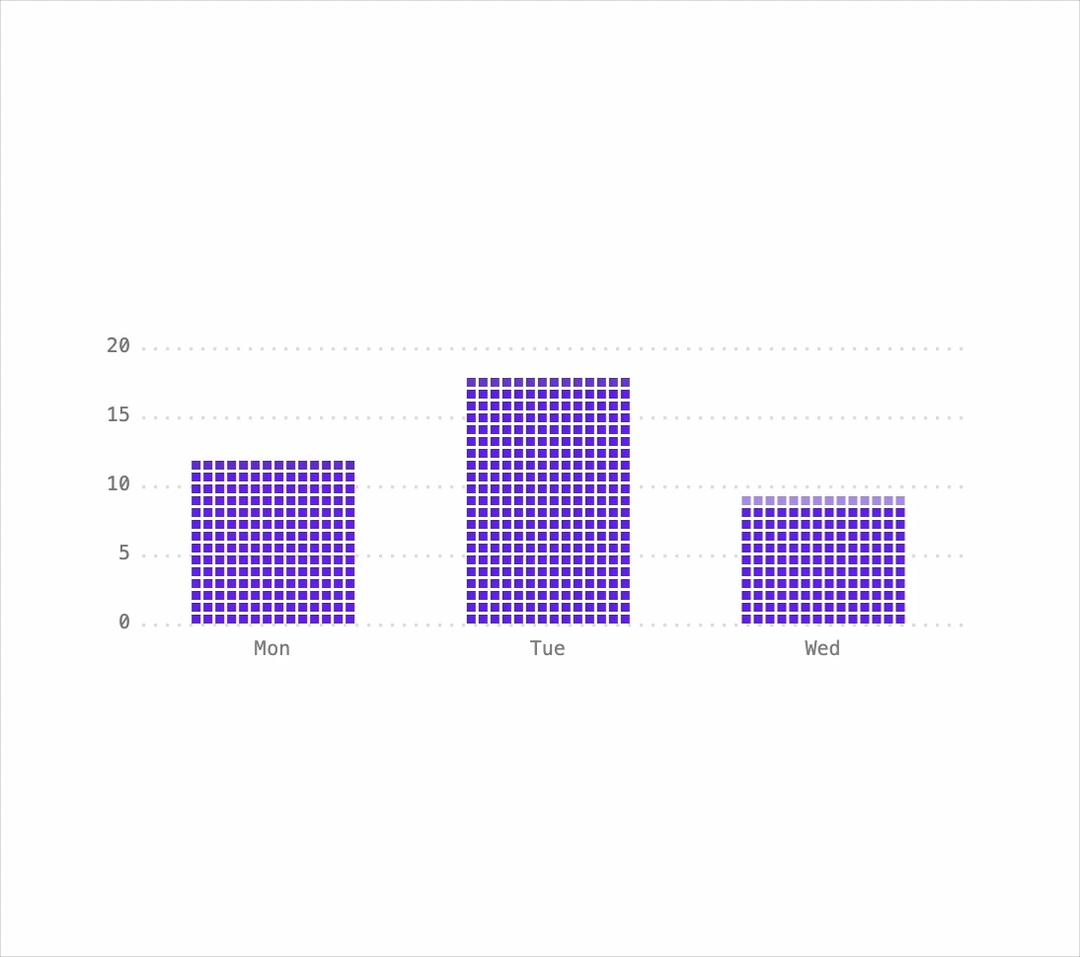
A canvas-drawn bar chart with a retro pixel look whose bars grow in cell by cell and spring to new data, showing exact values in a tooltip on hover or arrow-key navigation.
Built with React and Tailwind. Copy the prompt and paste it into Claude Code, Cursor or Lovable: your agent adds Pixel Bar Chart to your project and fits it to your theme.
Code
How Pixel Bar Chart is used: the demo's code. The component's own source comes with a free account.
Usage.tsx
import PxBars from "@/components/ui/px-bars";

export default function PxBarsDemo() {
  return (
    <div className="flex w-full items-center justify-center bg-background p-10 text-foreground">
      <div className="w-full max-w-md">
        <PxBars
          label="Runs per day"
          unit="runs"
          data={[
            { label: "Mon", value: 12 },
            { label: "Tue", value: 18 },
            { label: "Wed", value: 9 },
          ]}
        />
      </div>
    </div>
  );
}
More by lumesec
View all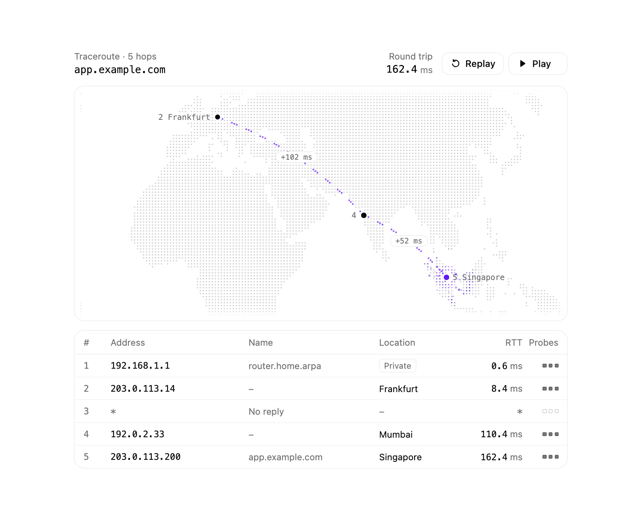

Geo Traceroute
56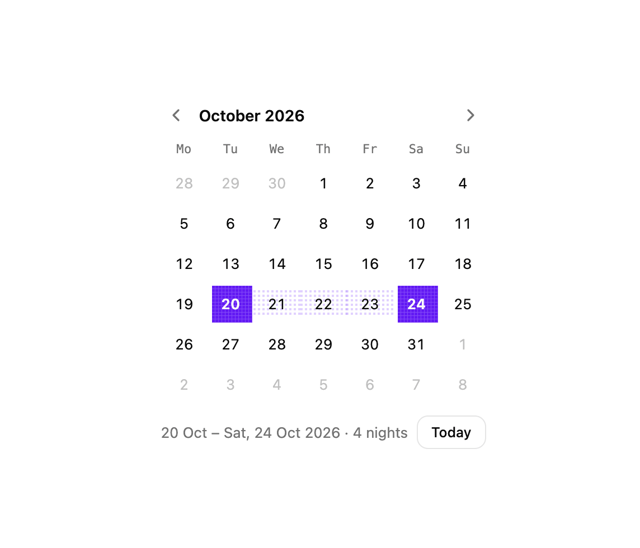
Date Picker
7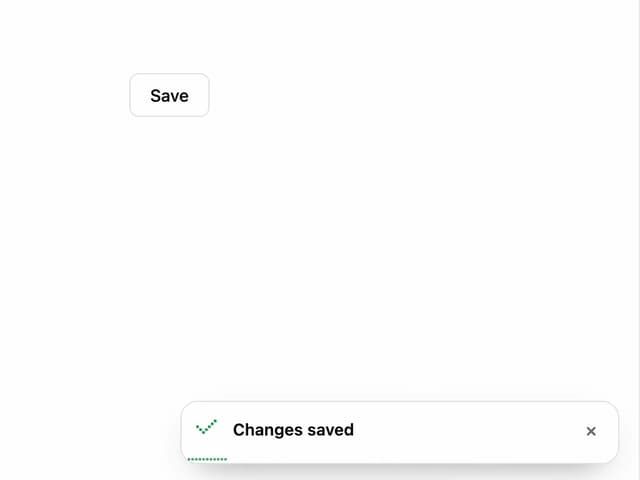
Pixel Toaster
6
Command Palette
4
Pixel Accordion
1
Rotary Dial
1
Pixel Select
Pixel Tabs
More in Dashboards
View all
Dashboard with Collapsible Sidebar
2.6K

Sidebar
347

SaaS Template
2.6K

Financial Bento Grid
105
Stats Bento
1.2K
Stats cards with links
40

Course Design Cards
1.2K

Chat template
641


